

Inferential Statistics
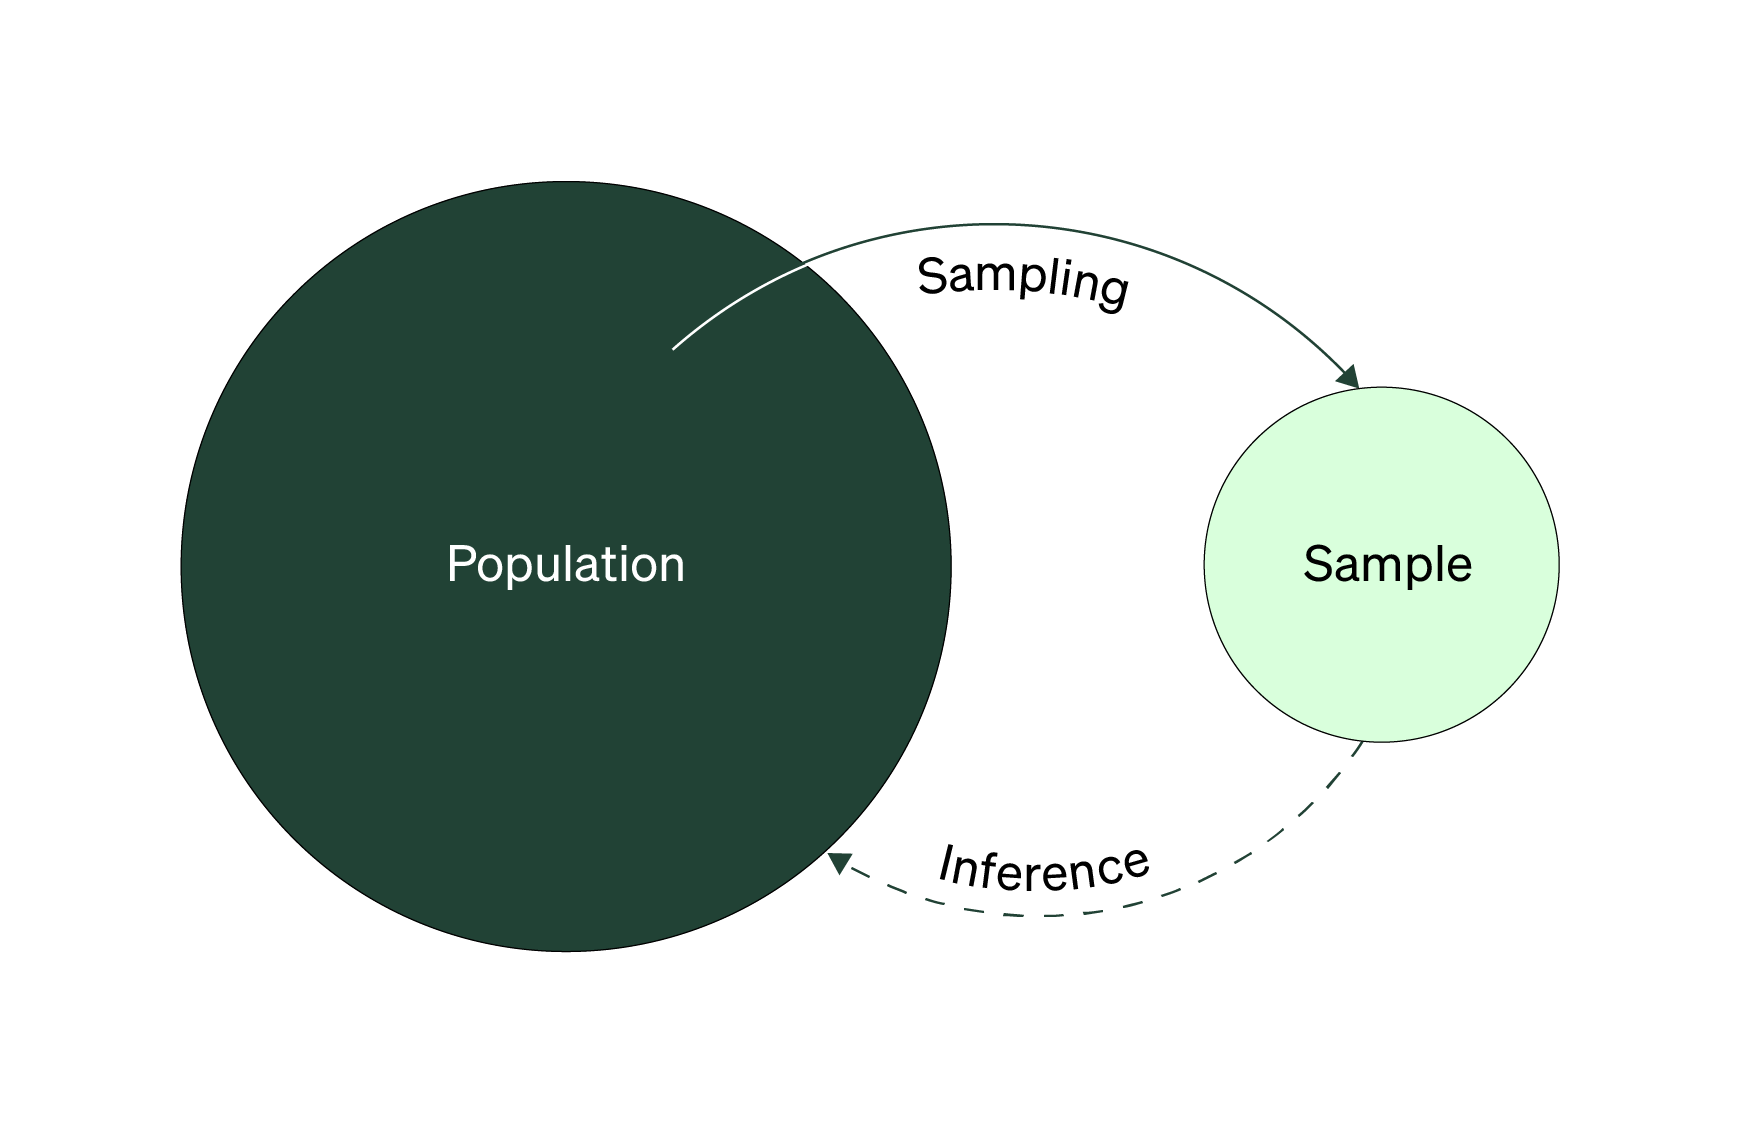
Recall this diagram from the handbook on sampling. The branch about sampling was covered heavily in Collection 2. The other branch, where you use your sample statistics as a way to estimate something about your population or segment is known as an inference.
Inferential statistics is focused on answering the question: based on your sample data, what’s happening or true at the population or segment level?
You can start to use inferential statistics in two ways: first, to estimate parameters of the population or to test how statistically significant your results are. Estimating a population parameter accurately and in an acceptable manner means using some form of random sampling.
In this situation, you’d create a confidence interval (also known as an interval estimate) to generate a range of possible values expected to contain the true population value. Click here for help on creating a confidence interval.
The other way is to involve something known as a statistical or significance test.
What is a significance test?
When you run quantitative research, you expect or assume something true. You set out to validate or invalidate that assumption by collecting specific data. To help you test that assumption, you look for patterns within your data to support or challenge that assumption. But the sample data you do have is just one of many possible variations of data you could’ve collected (jump to this Topic for more on variability).
Is your observed sample data a good estimate for the true population value?
You want to answer the question: “Is your observed sample data a good estimate for the true population value?” It’s hard to know if the patterns you found in your data are extreme or accurate for your population. In this situation, you turn to a significance test to help you answer this question.
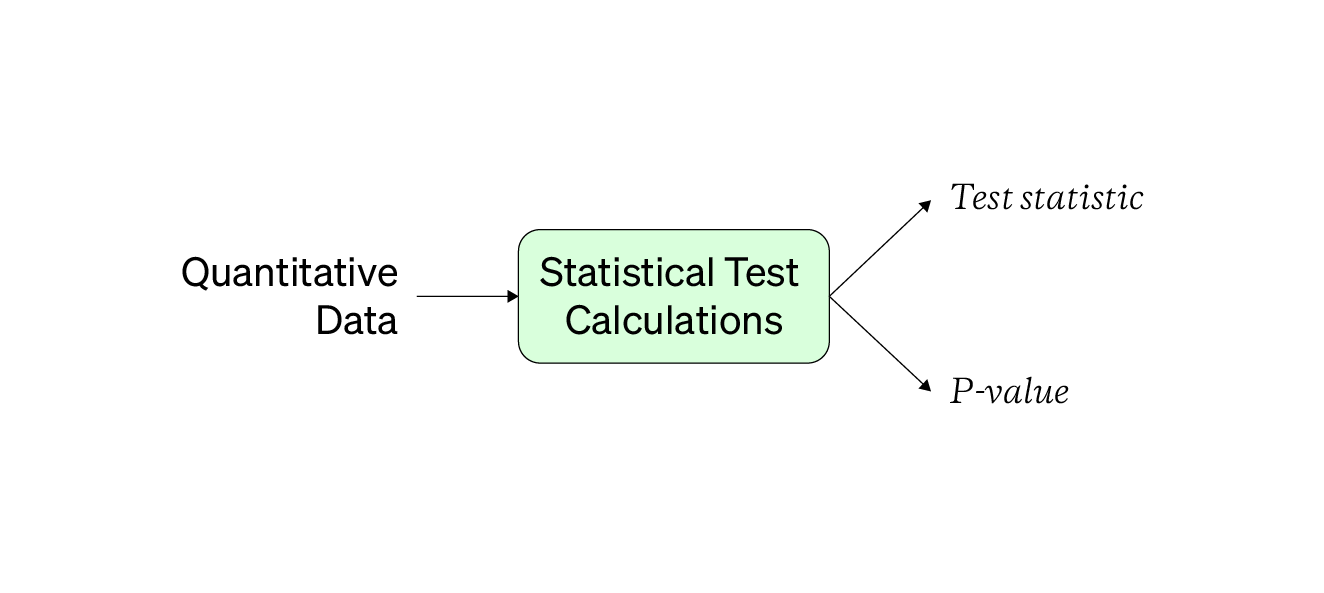
Every significance test takes some input (aka your quantitative data), performs some calculations, and gives you an output. The output is a test statistic and a p-value covered more in this section. Many researchers use significance tests for the following listed reasons:
Common Purposes for Significance Tests
- Estimate population parameter (mean or proportion)
- Comparing two or more values (means or proportions)
- Test a research hypothesis
- Describing or modeling the relationship between two or more values
You can easily list the steps to use a significance test in the short space, shown below.
Steps to Use a Significance Test
- Step 1: Make Assumptions
- Step 2: Write Hypotheses
- Step 3: Plan and collect data to test hypotheses
- Step 4: Check if collected data meet test requirements
- Step 5: Calculate Test Statistic
- Step 6: Interpret test statistic
- Step 7: Decide to accept or fail to accept null hypothesis
But you must consider factors that aren't readily apparent within and across the steps. Some later steps might affect how you act in earlier steps, so read through the next subsection for more advice. You don’t want to use significance tests incorrectly, waste your limited time, and end up reporting distorted, skewed findings. You can learn more about the steps here.
If you use a significance test incorrectly, your results will be meaningless.
Significance tests help you look at your quantitative findings to see if they’re credible and help back up your understanding and interpretation of your data. Patterns that might seem true at a glance might prove to be nonexistent when you use these tests appropriately. When used correctly, significance tests can help give you confidence in your quantitative findings, making your research more trustworthy and credible.
Some useful significance tests are listed in the appendix, and check out this fantastic resource that walks you through one hundred variations of useful significance tests. But no matter what test you use, you have to make sure you meet its requirements and assumptions.
Test Requirements and Assumptions

A significance test requirement is a threshold you need to meet to obtain the most valid test results possible. Think of requirements as a height requirement on a roller coaster; yes, you can go on the ride even if you’re not tall enough, but you also run the risk of seeing negative consequences.
Test requirements are like height requirements to ride a roller coaster.
Before using any significance test, make sure you understand all of its test requirements. Most requirements are centered around a few key factors listed below. Use this table as a handy reference when planning out your quantitative studies.
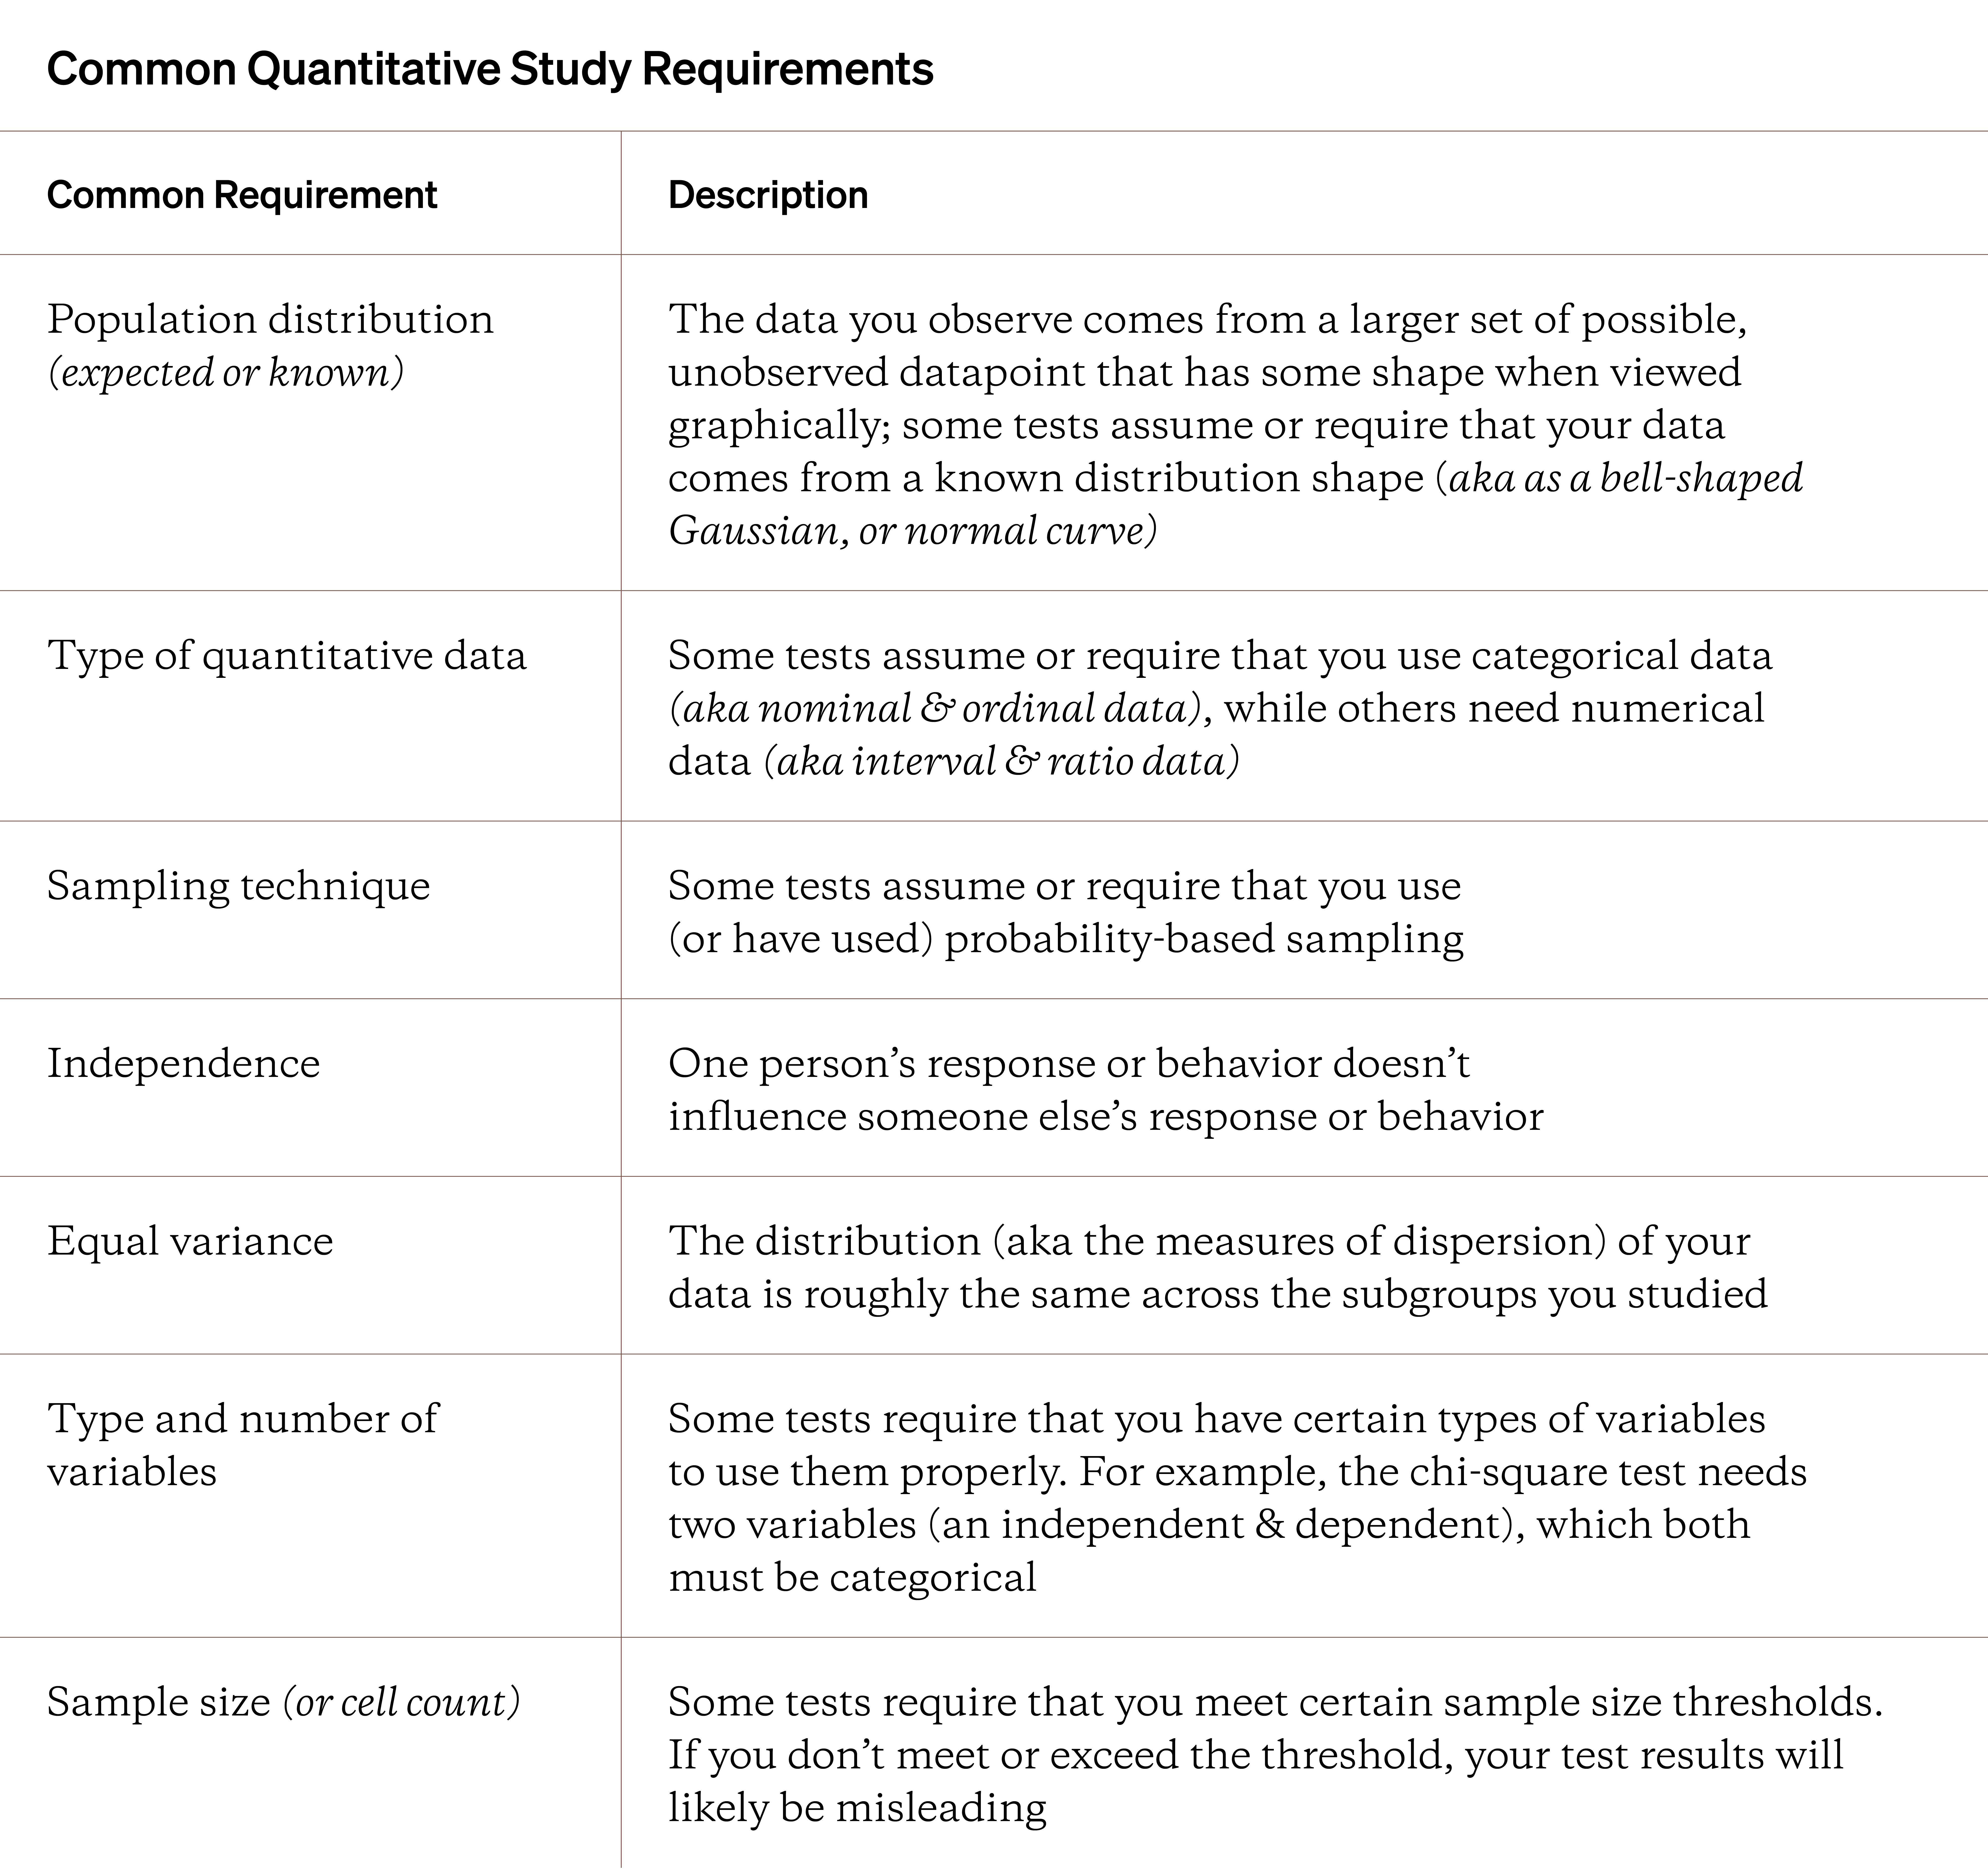
The concept of population distribution can be a bit confusing. While you can observe your sample data being skewed, you don’t always know if that exists at the population level. However, this concern only applies to quantitative-numerical data, not categorical data.
For categorical data, you assume your population doesn’t come from a known or defined population distribution shape, normally distributed on the things you’ve measured, meaning you use nonparametric tests. You can read more about nonparametric tests here.
These assumptions and requirements go alongside what a significance test was designed to do. You can be confident in your test results when you meet all test requirements.
As you’re reading, you might notice that you, the researcher, must make a conscious choice about whether you’ve met a test’s requirements and assumptions. But what happens if your interpretation is wrong?
Confidence in Results
You can use any test on any data to get some get test results. The only question is how meaningful and valid those results are. If you use a test built for ratio data on nominal data, you’ll get meaningless results.
A significance test has no idea about your context or intentions when it gets used – it just takes in data, runs calculations, and spits out a result. These requirements are static, meaning they don’t change from situation to situation. If you don’t meet test requirements, consider other approaches, or interpret the results with heavy skepticism.
There’s a list of things to look out for below that decrease confidence in your test results and how you interpret them.
Factors that Lower Confidence in Test Results
- Wrong test for the quantitative data you have
- Wrong test for your purpose
- Wrong test for the distribution you assume or expect
- Small sample size (in total or in specific cells)
The takeaway is clear: know what test requirements you need to meet when designing your quantitative study. You must work backward to collect the necessary data to appropriately use a significance test. If/when you run a test and interpret the results, you can be confident that the results are valid and useful.
Know what test requirements you need to meet before you collect any quantitative data.
Be honest and maintain integrity when you’re using a statistical test. Your stakeholders might not know how complex they can be, making it easy to mislead them when you want your quantitative findings to be seen as credible. If you weren’t able to use a test appropriately, tell them or avoid reporting those findings altogether.
One of the most confusing but important parts of a significance test’s results has to do with something known as the p-value.
The P-Value
P-values are one part of a significance test’s output. The p-value is used to determine whether your test results are significant. Significance in this context means that your results have a low probability of randomly occurring.
Or, put another way, your test results are likely indications of a real pattern and not something that would’ve randomly happened. The smaller the p-value, the stronger the evidence of that pattern being real or plausible.
The most common p-value used as a threshold for significance testing is 0.05 (denoted with the Greek letter alpha, α, or referred to as the significance level). P-values smaller than 0.05 are described or reported as statistically significant. Researchers commonly use an asterisk (*) to mark statistically significant findings (ex: p = 0.035*) in their reports.
Don't use p-values as the only way to confirm quantitative patterns and relationships.
However, don’t use p-values as the only way to confirm patterns in your data. Become a detective, slowly and methodically collecting evidence to test your null hypothesis (jump to this Topic for more on hypotheses). During your EDA, you might notice other patterns that suggest that your null hypothesis should be rejected.
While p-values are seen as critical pieces of evidence when deciding to reject your study’s null hypotheses, using p-values in quantitative data analysis isn’t without criticism.
P-value Criticisms
The most common significance level is 0.05. However, this 0.05 value was essentially pulled out of thin air by a statistician, Ronald Fisher. In 1925, Fisher postulated that if your p-value is lower than 0.05 or 5%, it seems unlikely that your findings are based on pure chance. The 0.05 value has essentially no mathematical basis but was selected because it seemed plausibly appropriate (Fisher, 1925; Bakan, 1960).
Interpreting your observed p-value can also be incredibly subjective. For example, are your findings significant if you observe a p-value of 0.051? Or what happens if you see a value of 0.0499 — is it barely significant?
Examples in both published scientific and business literature show that the language used by researchers around p-values close to 0.05 significance levels can show signs of this bias. Phrases like “marginally significant”, “nearly significant” or “partially significant” lessen the credibility of all researchers using the p-value in research.
Even worse is the idea of p-hacking. Researchers manipulate their data so they can almost guarantee significant results. Either the researcher has a preplanned conclusion they need to reach, so they plan their study accordingly, or they use every statistical test to find one significant result (an example of exhausting your data to find patterns you want or need).
The p-value isn't perfect but it's a recognizable and acceptable way for interpreting your quantitative data.
This doesn’t mean you shouldn’t use p-values in your analysis. It’s still one of the few standardized ways of looking at data by researchers worldwide across dozens of scientific domains. The p-value isn’t perfect, but it’s a valuable tool to make sense of the quantitative patterns you’re seeing. Recognize that it’s not perfect, and you, the researcher, play a fundamental role in using it appropriately.
As mentioned earlier, you might use a significance test to validate a research hypothesis. Independent of your test results and p-values, there’s always a chance that you’ll come to the wrong conclusion.
The Decision & the Risk
When you test your hypotheses, you’re trying to do one of two things: use evidence to reject the null hypothesis (Ho) in favor of the alternate (Ha) or fail to reject the null hypothesis.
However, this doesn’t mean that these decisions are clear-cut. What happens if you reject the null when you shouldn’t have? Or what if you incorrectly determine that there’s enough evidence of a real pattern when there isn’t one?
If you think this language is confusing, you’re not alone. The language used around hypothesis testing is inconsistent and challenging to understand and use properly. However, the complexity is important because the hypothesis and statistical tests are designed under specific conditions to obtain valid results).
Type 1 and Type 2 errors (or events) occur when you make the wrong decision when testing. Let’s use the diagram below to explain both more.
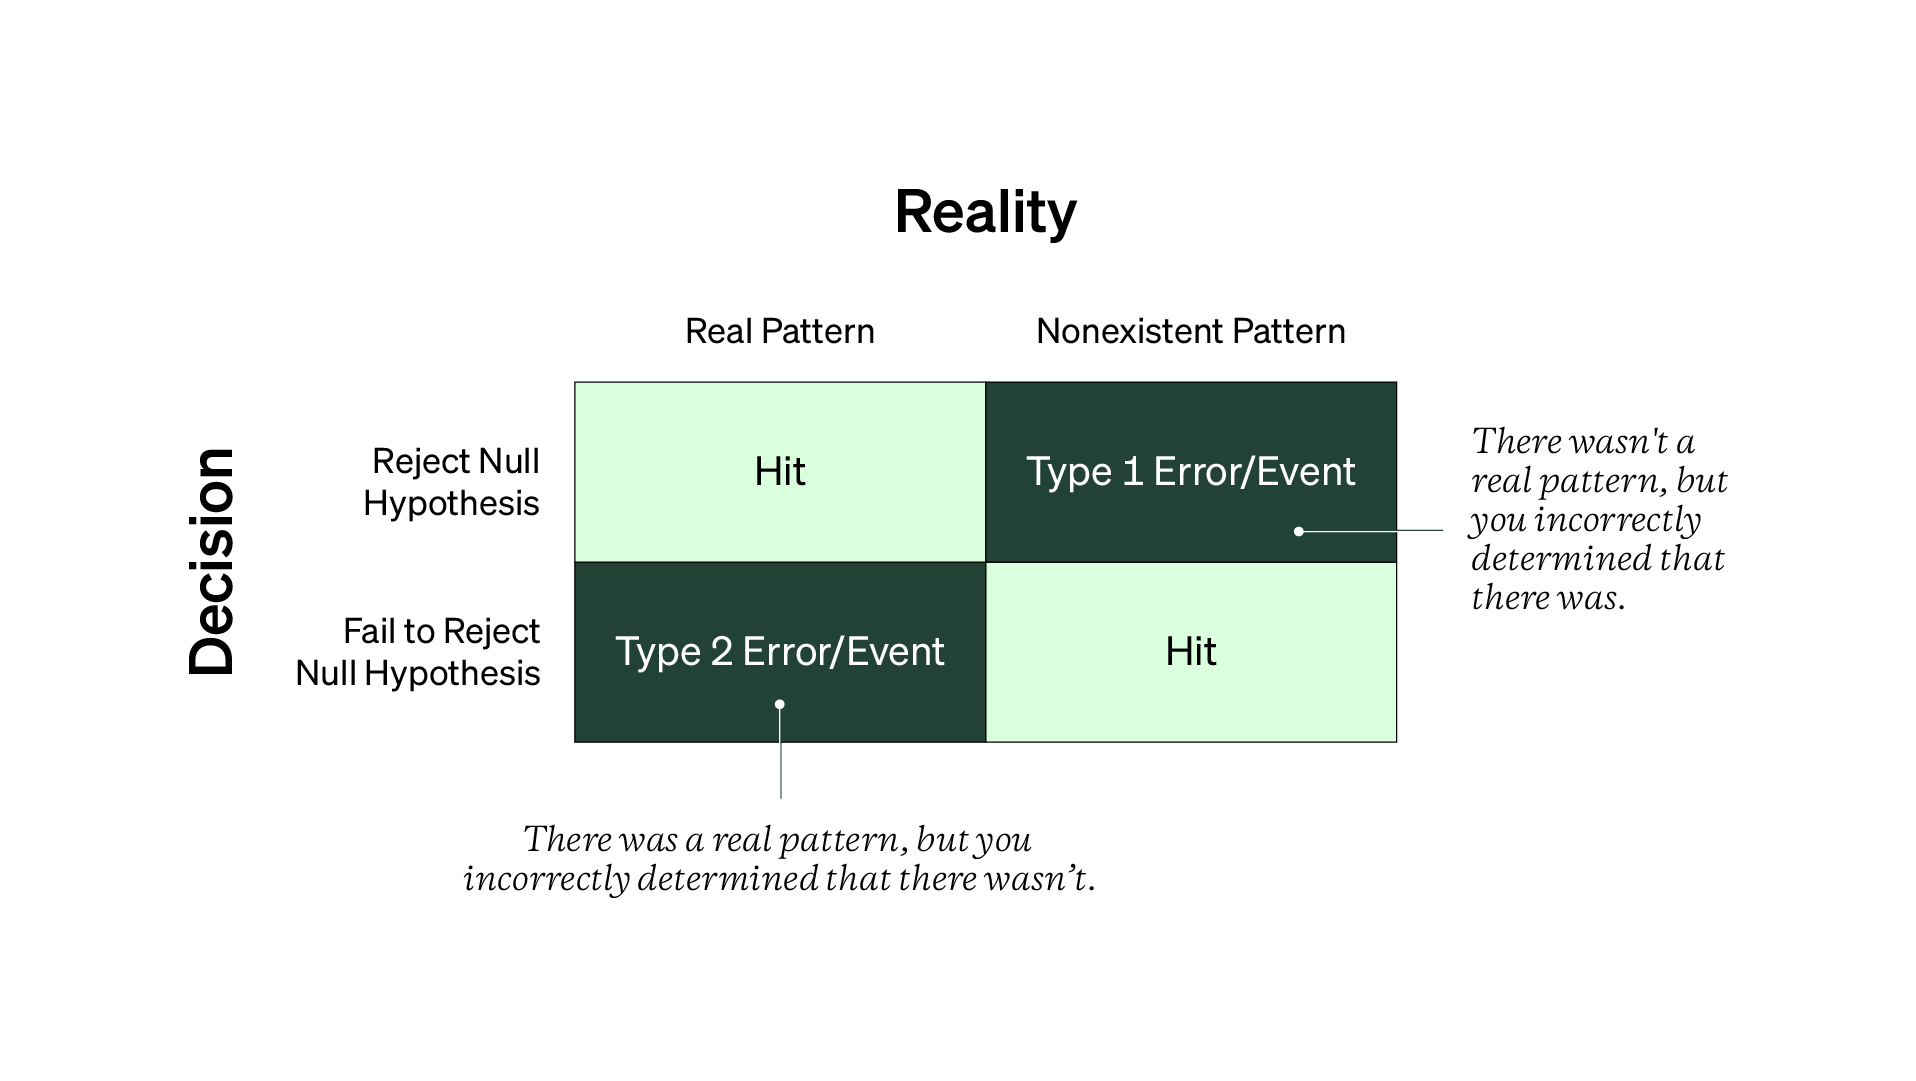
On the left side is your decision to reject or fail to reject your null hypothesis. On the other side is reality or the true population value you’re trying to estimate (note that you don’t know what this true answer actually is. (Jump here for more on “The Estimation Paradox”).
Type 1 events are when you go through your entire analysis and incorrectly conclude that there’s a real pattern when there isn’t one. In this case, it’s a false positive. The other red cell is Type 2 events, when you mistakenly fail to reject the null, meaning you didn’t detect a real pattern.
Note that if you knew the right answer, you wouldn’t go through all this effort. But in practice, being aware of Type 1 and Type 2 events keep you skeptical about your results. When deciding what to do with your hypothesis, you need accurate and valid data (that comes from an appropriate quantitative study design with enough participants).
The alpha-level (aka 0.05) is the probability of a Type 1 event, while the beta-level (or just beta, denoted with the Greek letter, β) is the probability of a Type 2 event. Beta is also known as statistical power. You can learn more in this Toward Data Science article here.
Practical Significance
Even if you have low p-values, that doesn’t mean your test results are helpful or practical to your stakeholders. Does it help them make smarter decisions knowing that the pattern/relationship between two variables was statistically significant? When you’re planning on using a significance test in your quantitative study, recognize that any test results might not be valuable or even interesting to your stakeholders.
Statistical significance is not the same as practical significance.
Statistically significant results tell you that what you’re seeing in data is unlikely to have randomly happened. Practical significance is about how meaningful or useful your test results are in the real world.
For your stakeholders to see value in your quantitative research, the results have to point to important patterns between people and the product, outside of spreadsheets, analytical software, and calculators. A good question to ask yourself is “If your findings were statistically significant, what does that mean about the people you’re trying to understand?” For more, check out this PDF.
Effect sizes are also commonly used to determine whether test results are significant. Effect sizes quantity the differences between two or more variables or groups. The larger the difference, the greater the effect. Check out the guide, Using the Chi-Square test, for an example of effect sizes (the Cramer’s V test) being used in quantitative data analysis.
Guide 12: Using the Chi-Squared test
Let’s end this handbook by reviewing some of the more complex but powerful quantitative analysis techniques you might want to use. You limit the number of quantitative research problems you can confidently handle without knowing how to improve your quantitative analysis skills.
- Confidence intervals
- Significance tests; null hypothesis significance testing (NHST)
- P-value; p-value criticisms; p-hacking
- Power analysis
- Effect size
- Main effects; interaction; fixed and random effects
- Practical significance
- Minimum sample size estimation
- Normality assumptions
- Type 1 and Type 2 errors or events