

Introduction
In this Topic, let’s look at one strand (concurrent) mixed designs. Namely, let’s focus on designs where you look to merge your mixed data or enrich one set of data with the other. For two strand (sequential) mixed designs, jump back to Topic 3 for more. And as shown in Topic 3, here’s a table that gives an overview of popular and common mixed designs.
Overview of Common Mixed Designs
Let’s break down a very popular mixed design: the triangulation design.
Merging-Triangulation Design

The triangulation design is a one-strand (concurrent) mixed design. It’s used for one clear purpose: to find agreement, consistency, or corroboration of your qualitative and quantitative findings and their meta-inferences. In this design, while there’s only one strand, both methods have equal priority.
This design is great for complex problems where the risk of being wrong or skewed with your findings is high (like with strategic research).
The triangulation design is also referred to as the convergent or the parallel mixed methods design in online mixed methods literature.
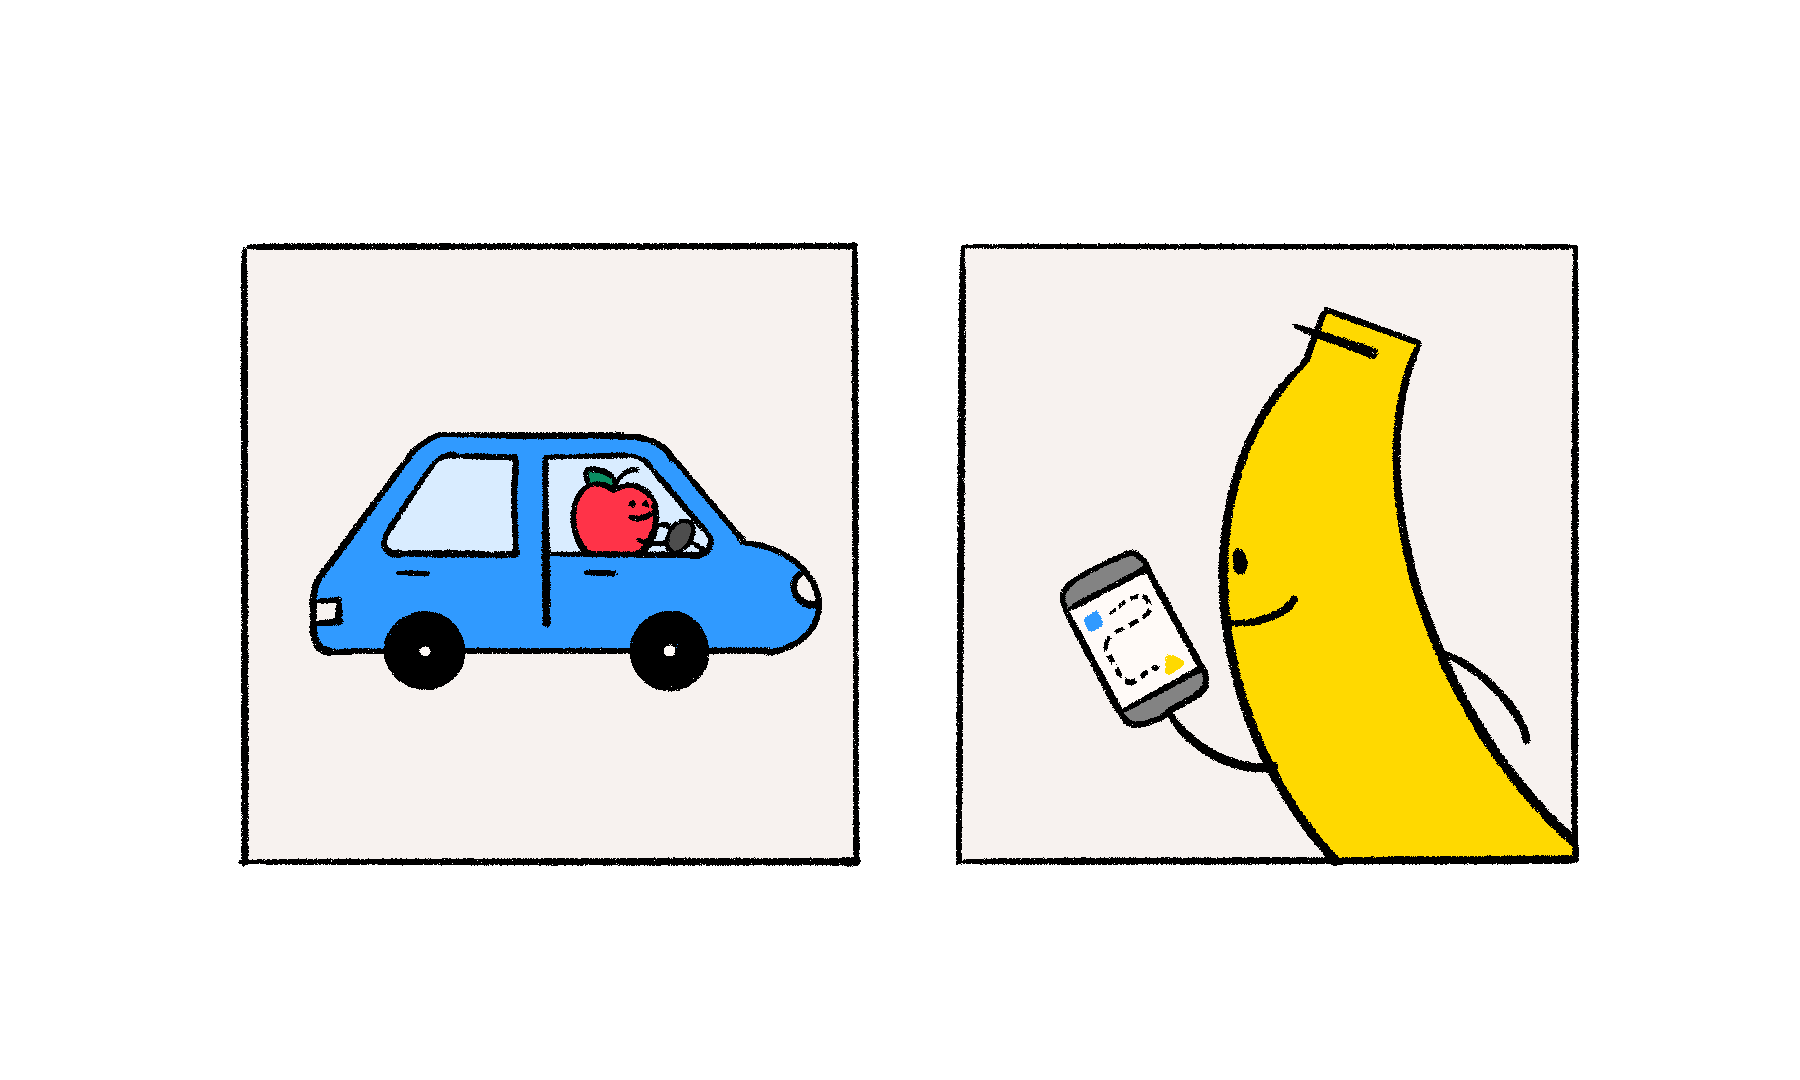
You study the same research question or topic but attempt to arrive at a single set of meta-inferences and conclusions using both qualitative and qualitative findings. Unlike other mixed designs, the two sets of data are analyzed individually. Integration happens when you get to interpretations of both sets of data.
Triangulation is a common phrase used in the UX research space. But what does it mean?
Triangulation works off the assumption that studying something from multiple perspectives leads to a deeper understanding than one perspective alone.
Triangulation is when you use multiple sources, methods, or perspectives to study the same research question or topic. The more diversity you have in how you study something, the greater the chances that you understand it deeply or accurately. Triangulation works off the assumption that looking at a question from multiple perspectives will lead to findings that are more valid or credible than by any single perspective. The triangulation design uses method triangulation.
There are many types of triangulation, discussed more in this PDF.
Below are the properties of the triangulation design. Unlike other mixed designs covered in this Handbook, a triangulation design can only be planned. With only one strand and the requirement that both methods address the same research questions, you need time and alignment to prep and execute this type of mixed design.
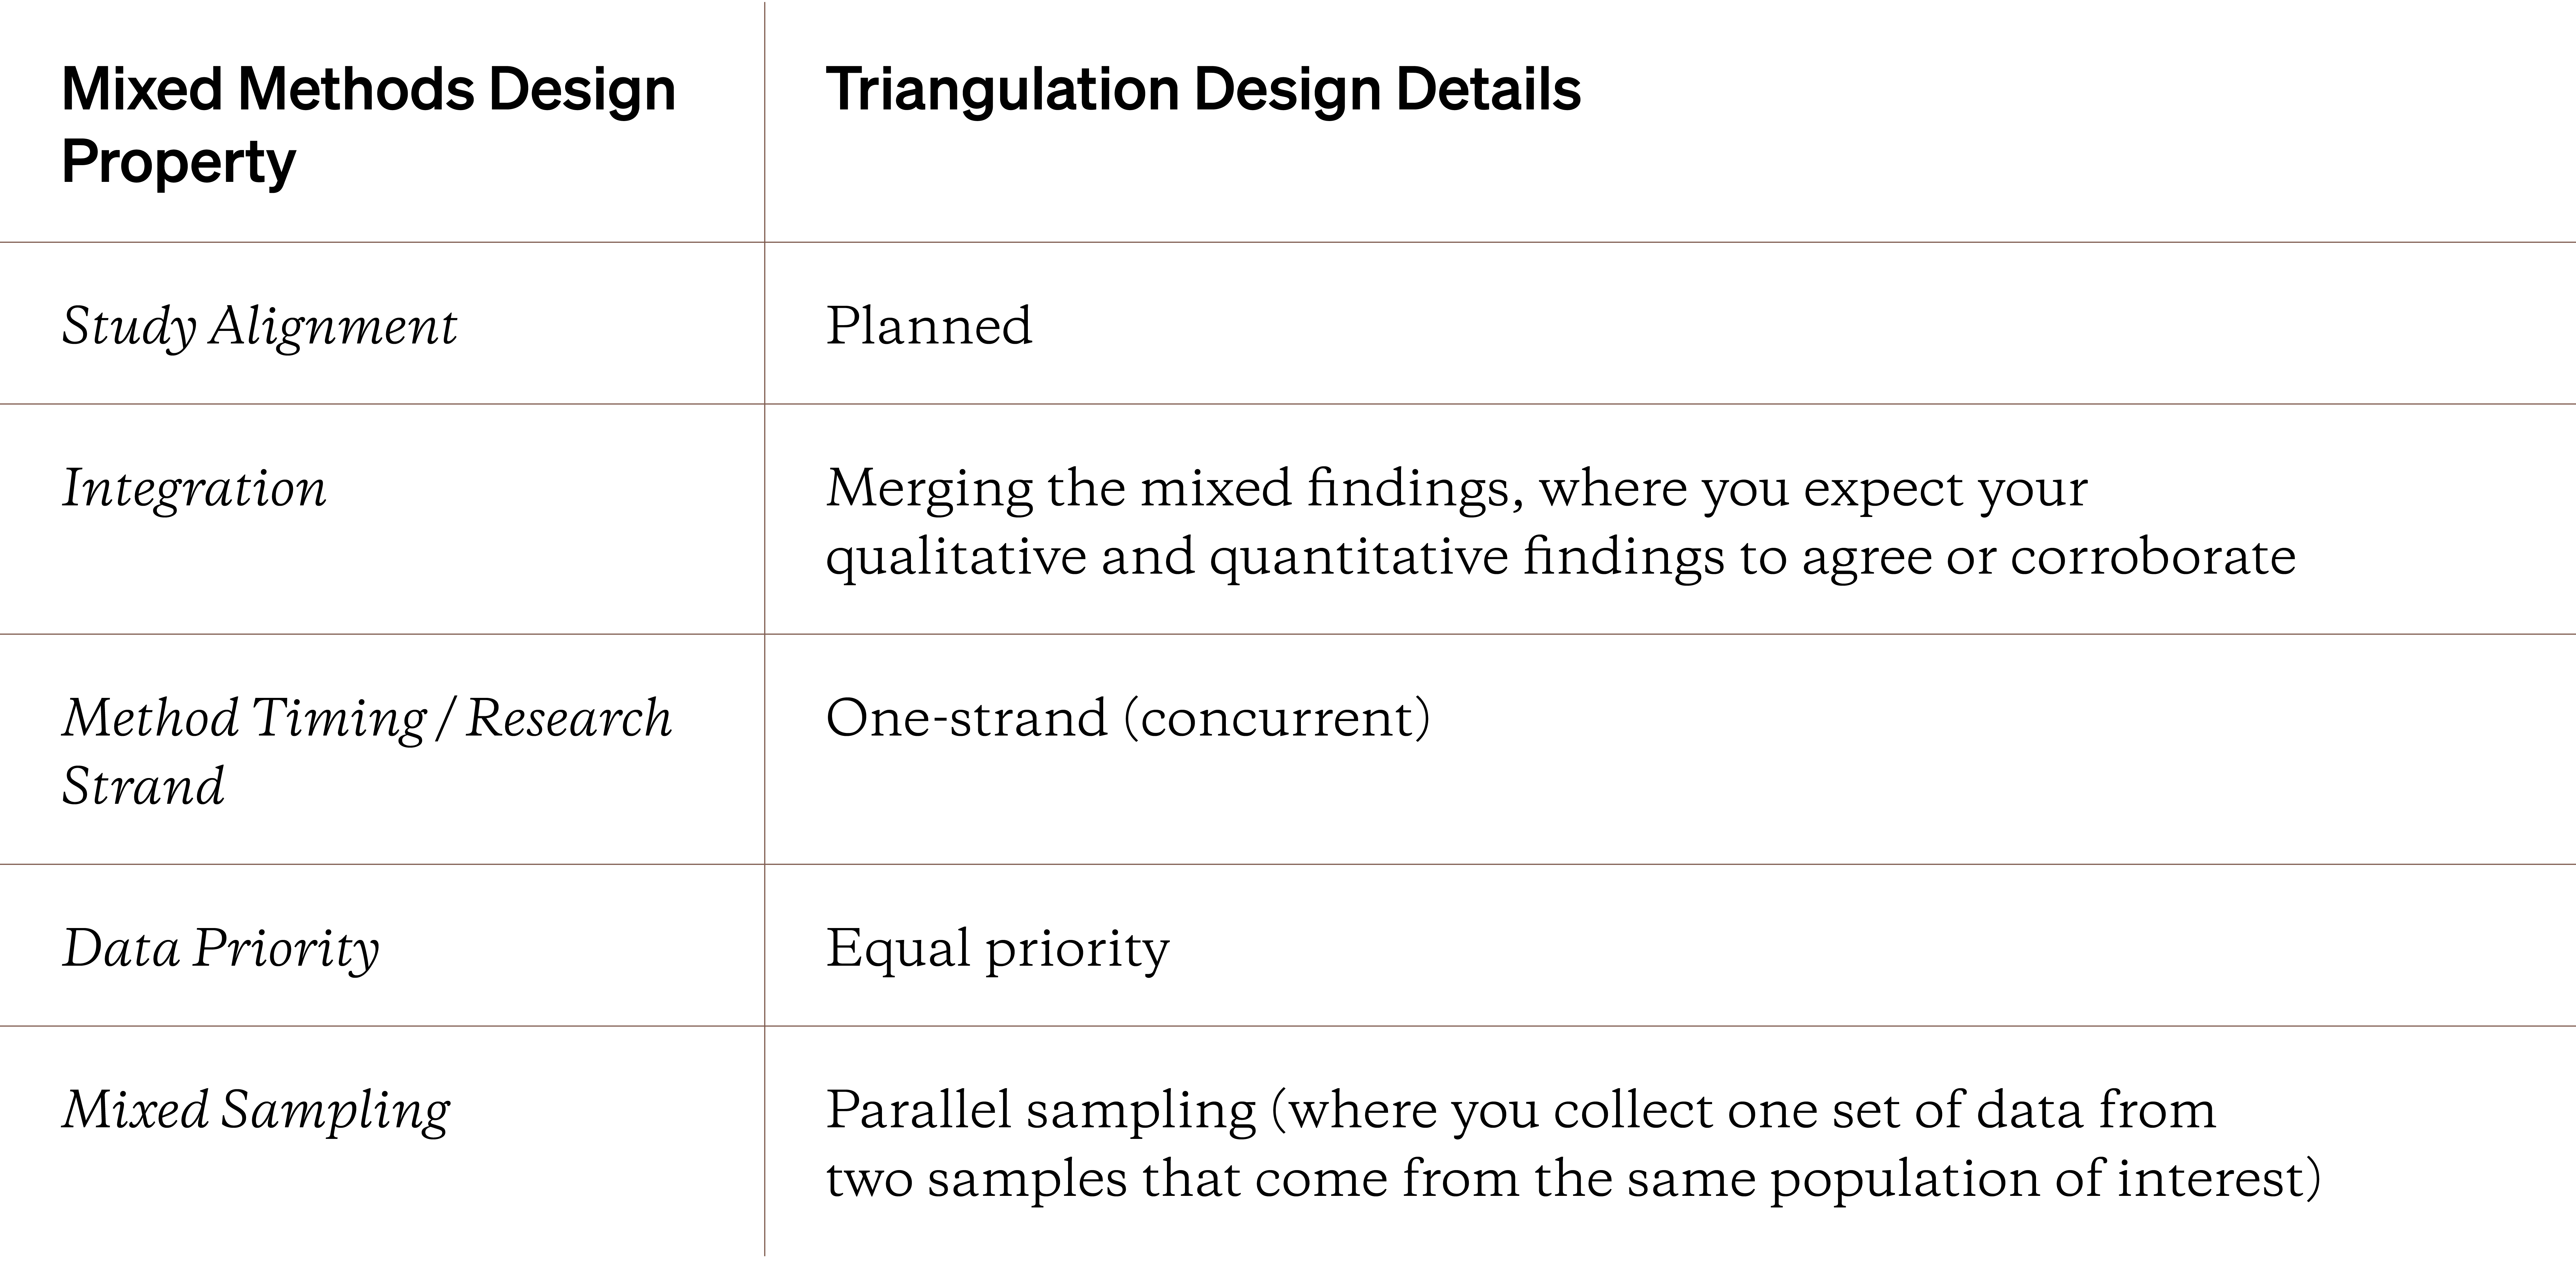
Commonly in a triangulation design, qualitative interviews are paired with a quantitative survey. Both methods address the same research questions. Both methods also collect data from the same population of interest. And unlike other mixed designs covered so far, you collect all of your qualitative and quantitative data before analyzing it.
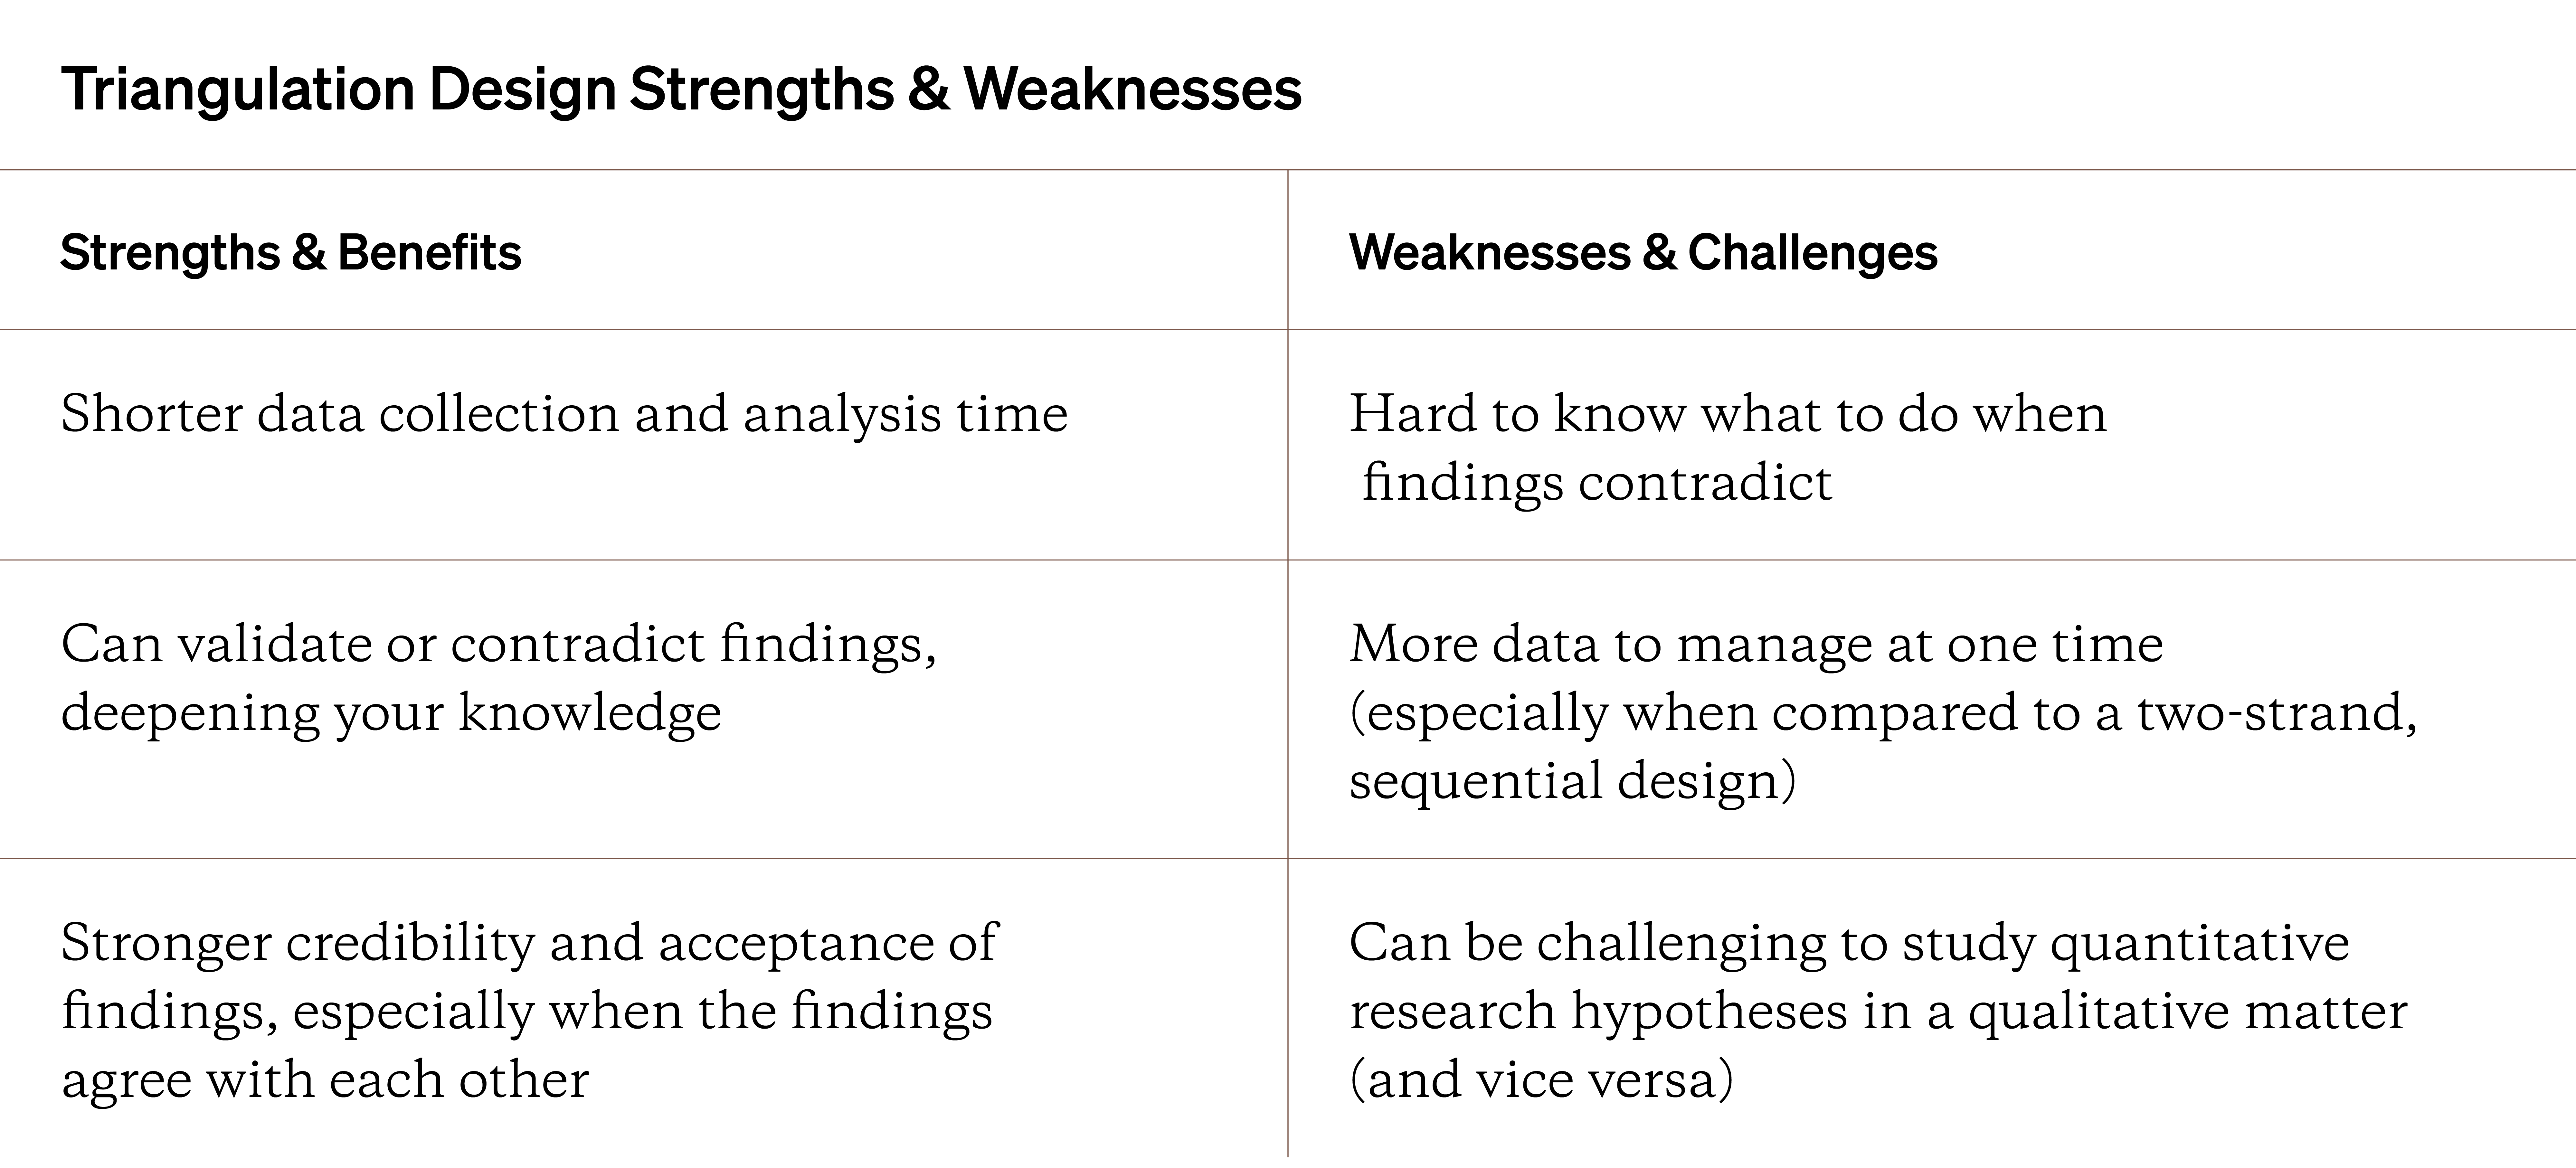
One strand can mean a shorter study timeline. But it also means dealing with a lot of data at one time which can be stressful and lead to research blunders. Other strengths and weaknesses of the triangulation design are covered below.
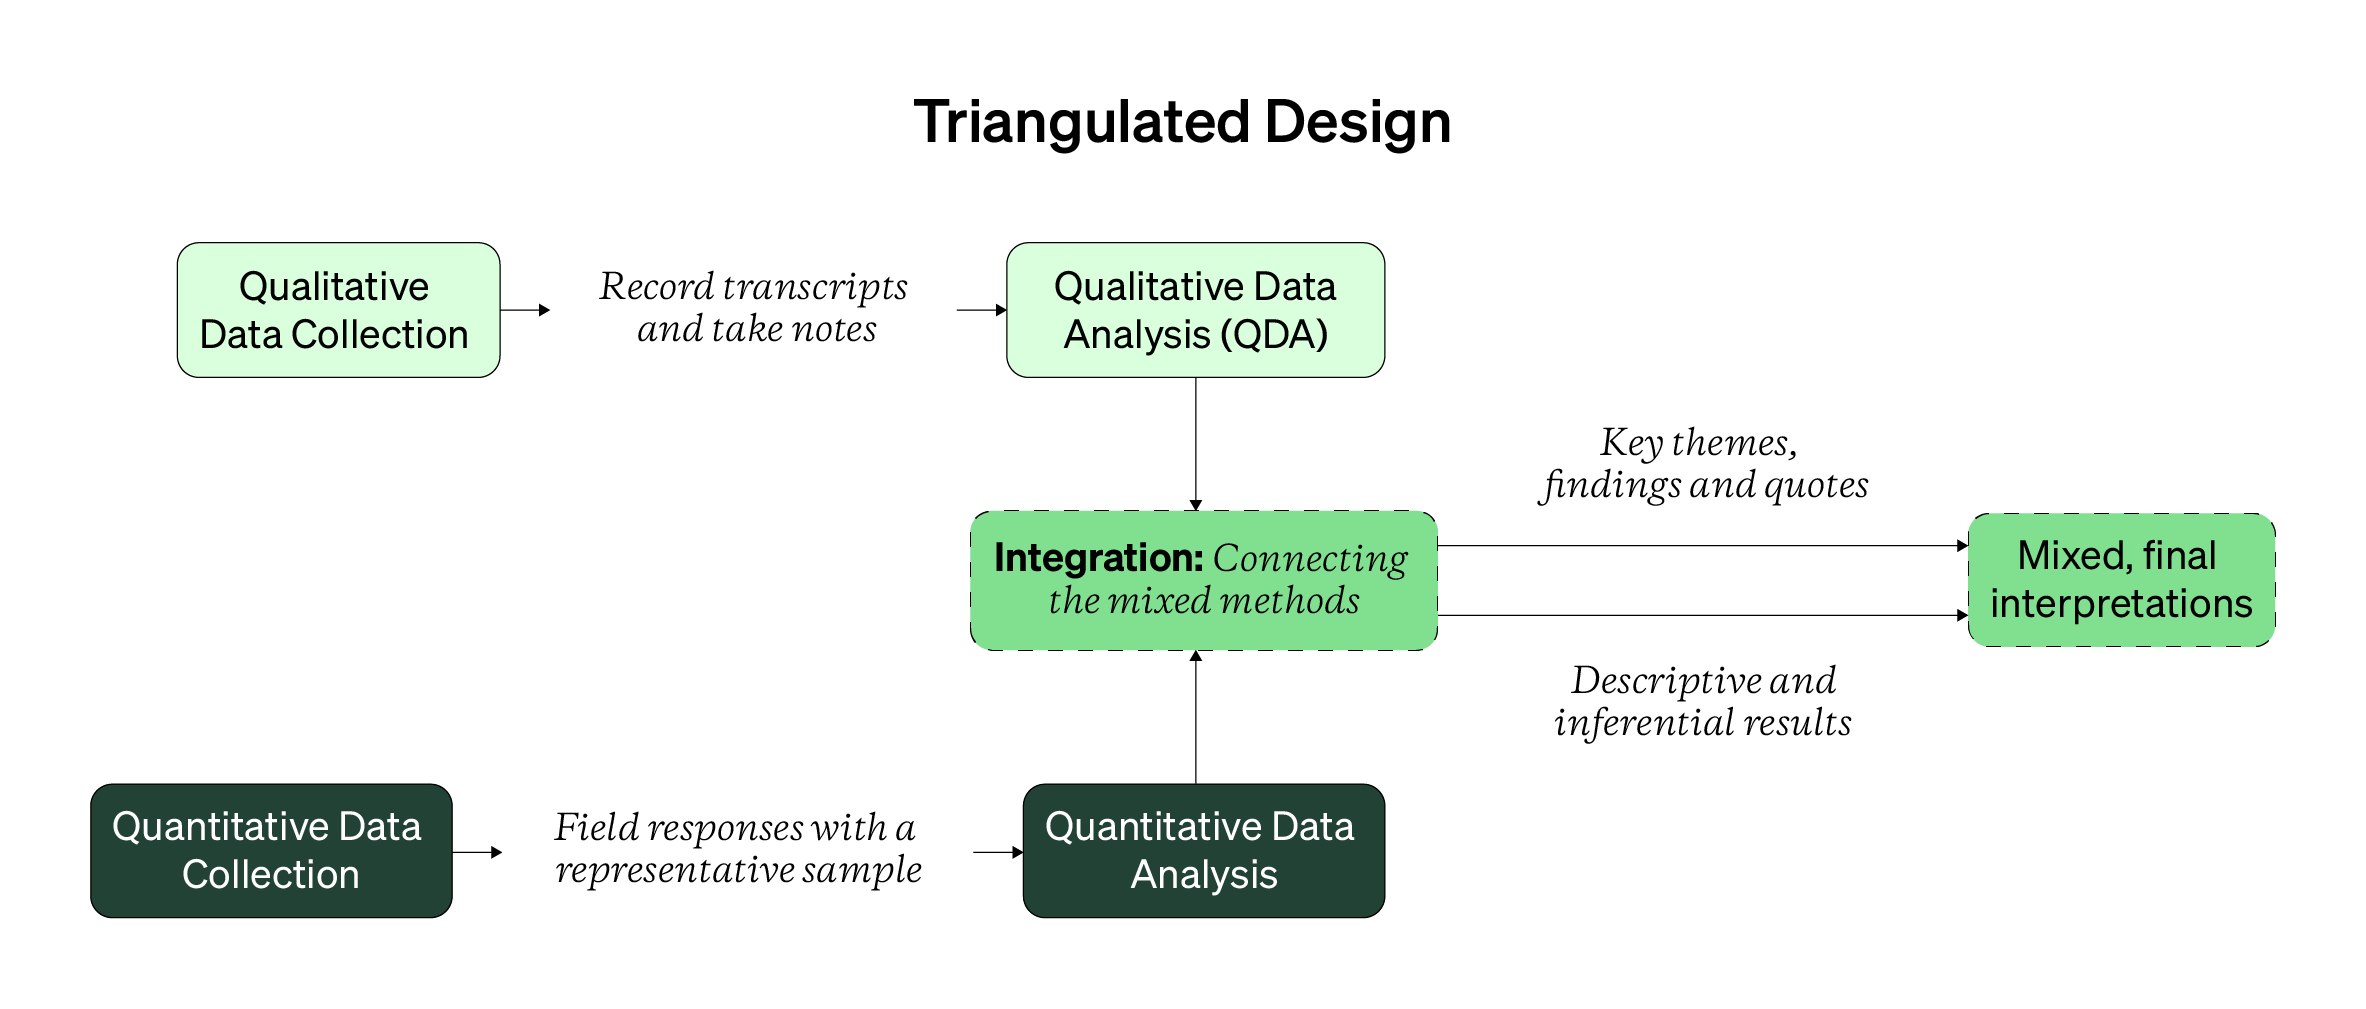
Finally, let’s end this design by seeing how all the properties show up in practice. As with the mixed designs in the last Topic, underneath a visual walkthrough of each design, there are scannable behaviors and outputs that your handy reference.
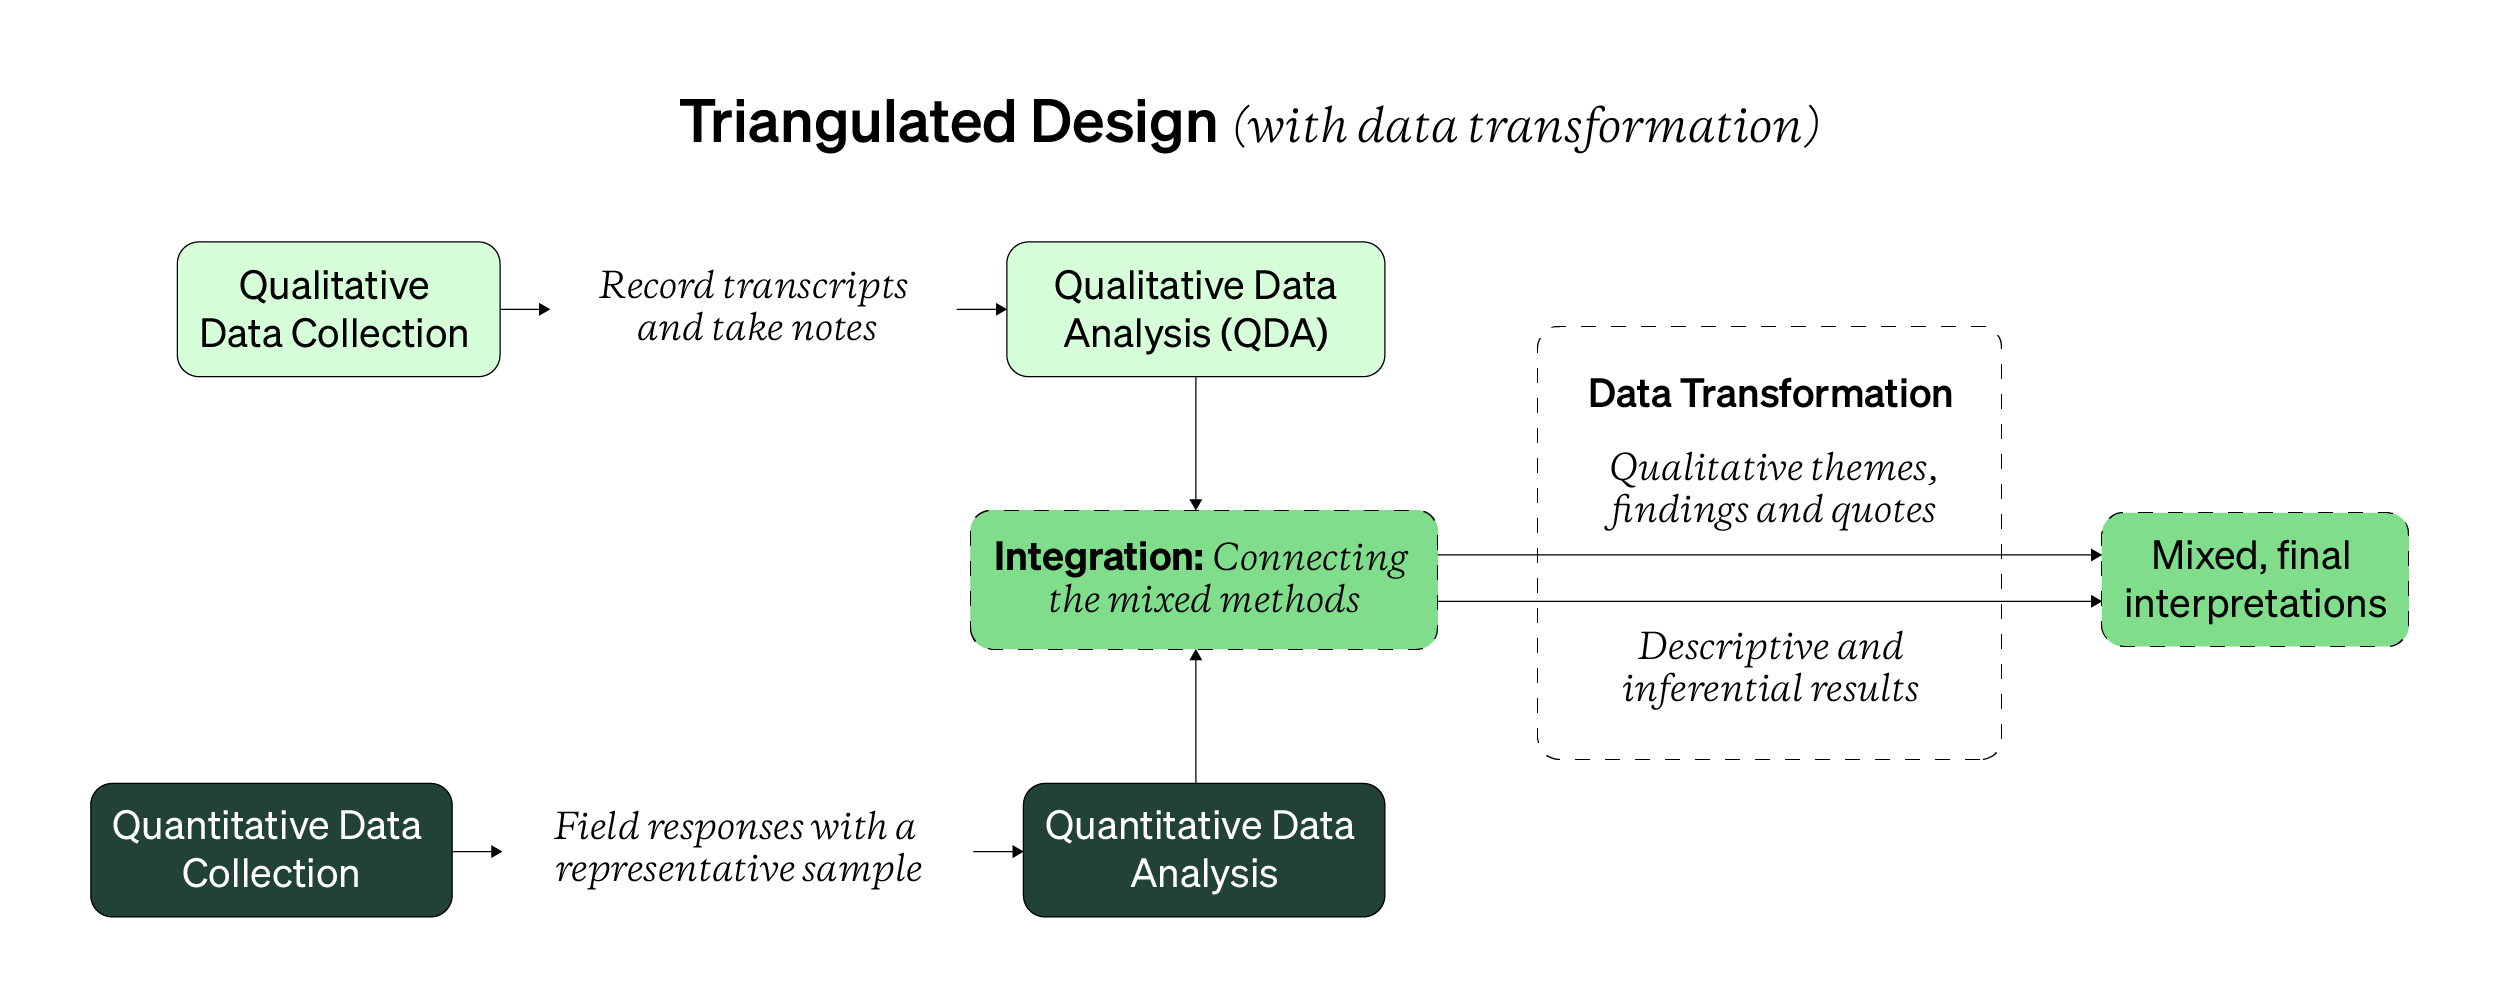
One quick note: there are two visual walkthroughs for the triangulation design. The second walkthrough shown below has you transform your data. Data transformations are when you convert or represent your qualitative findings into a quantitative format, and vice versa. An evolving area of mixed methods research, you can learn more about data transformations in Topic 5 in this current Handbook.
Today, researchers tend to transform only their qualitative findings and compare these new, transformed “quantitative” findings with the untransformed quantitative findings.
And to aid the visual walkthrough, here are some behaviors and outputs for the triangulated mixed design.
Triangulation Design Behaviors and Outputs
- Write one set of research questions to be studied qualitatively and quantitatively
- Choose two research methods (one qualitative and one quantitative) to address the same research questions
- Collect both sets of data
- Structure and analyze both sets of data, independently
- Arrive with qualitative and quantitative findings for the same research questions
- Transform your findings and/or arrive at meta-inferences based on the qualitative, quantitative (and/or transformed) findings for the same research questions
You can read more about the triangulation design in this public chapter (starting on page 77) or this YouTube video.
Merging/Enriching Multi-level Design
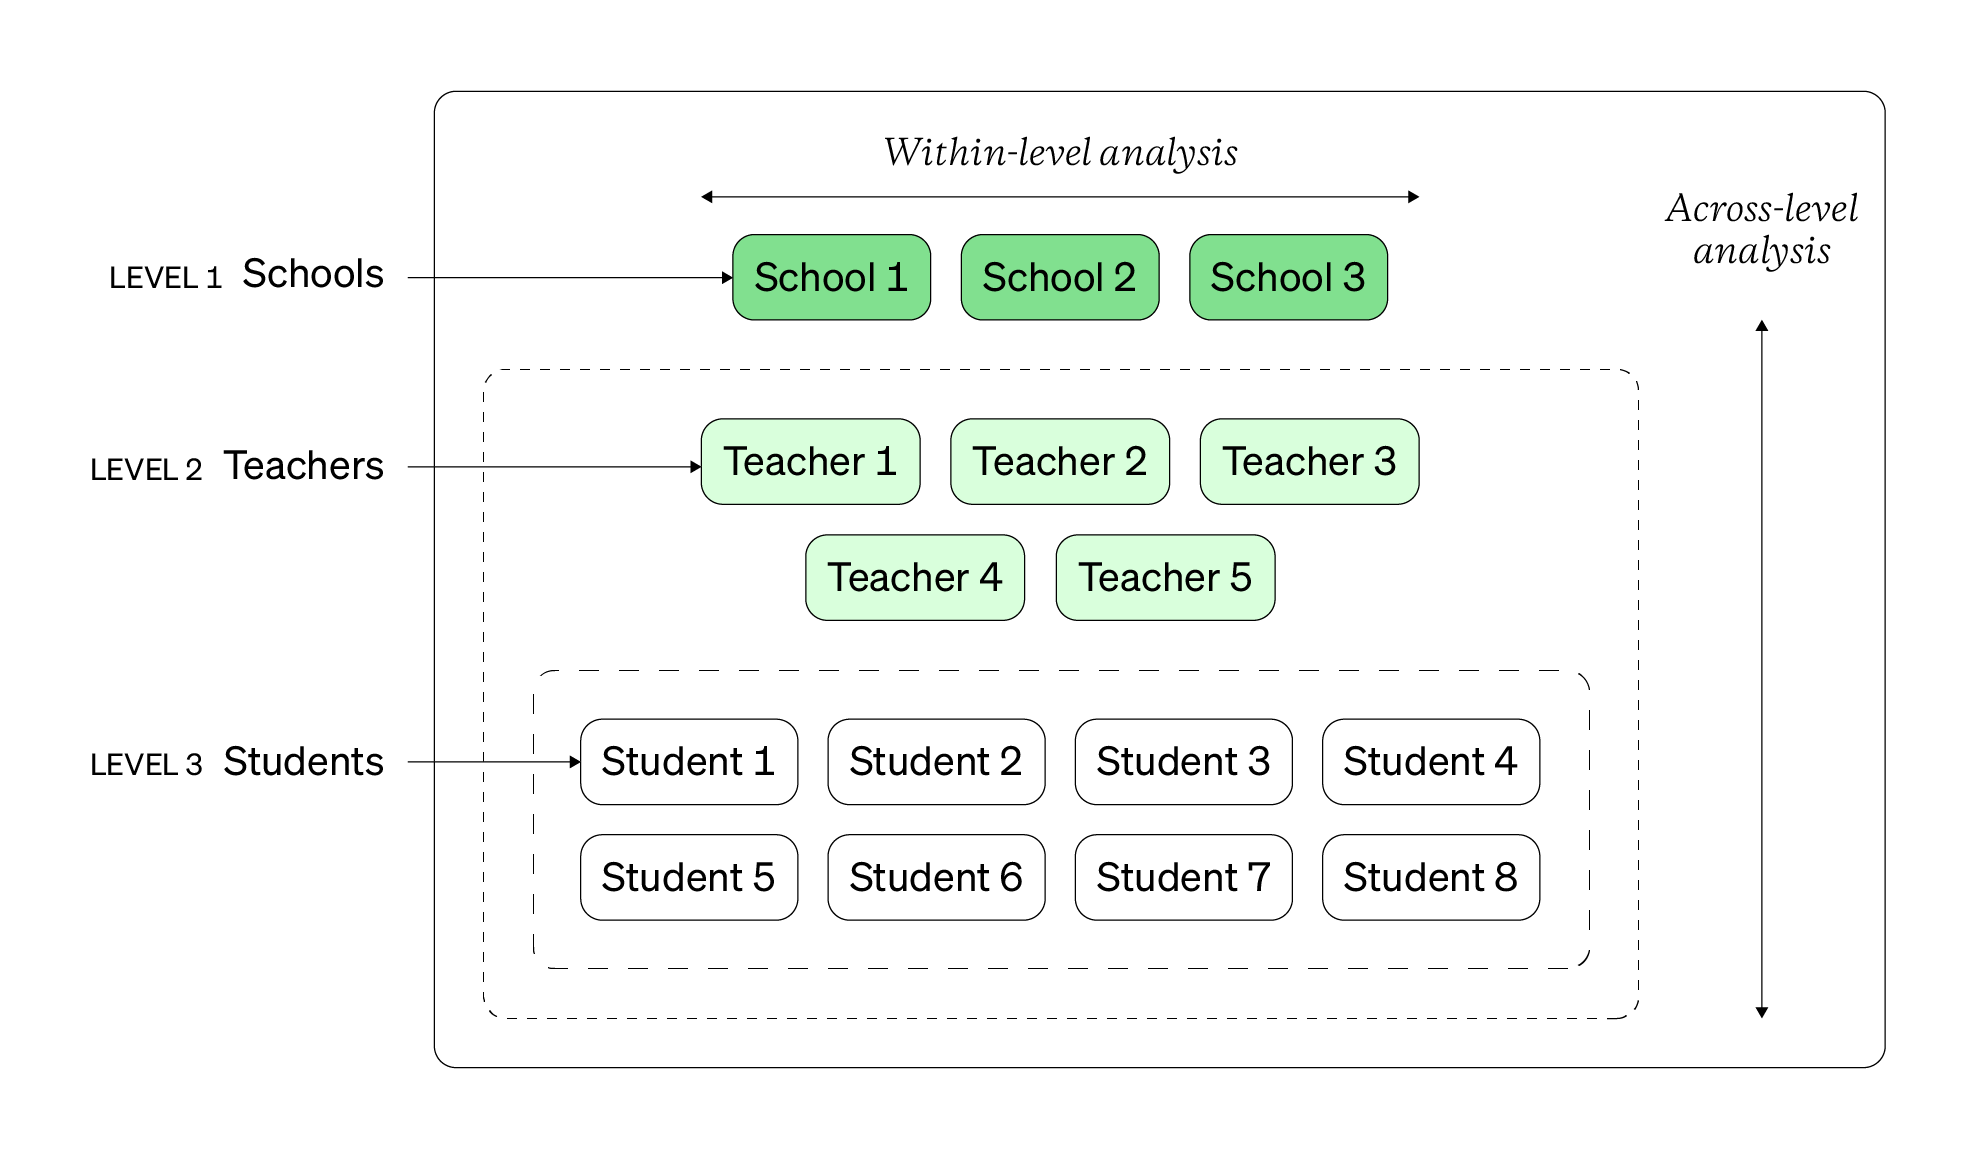
The multi-level design is typically a two strand (sequential) mixed design. It’s used to understand the same or interrelated research questions across and within specific sub-groups that come from the same or interacting population. In the diagram below, the population would be those in a school setting (aka teachers, students, and the schools themselves).
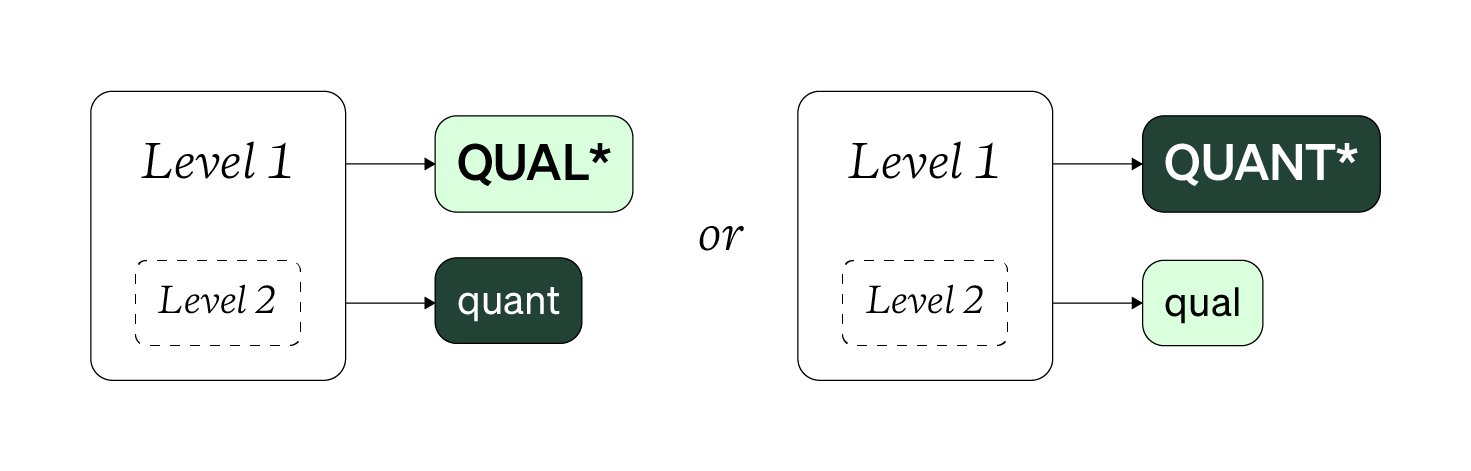
Typically, the level that you’re most focused on understanding tends to be labelled as “level 1”. Levels that tend to cover more cases (such as large geographical regions), tend to be studied quantitatively due the impractical effort required to collect a ton of qualitative data at scale.
What’s unique about multi-level design is how the levels are operationalized (C3H1T3) and studied. You make a conscious choice to define levels that are important to understand individually and together. When you put them together, you can also how they fit together to notice patterns at higher, broader levels. This means the patterns that exist within each level contribute and influence patterns about the entire system of levels.
You can also have more than two or three levels. But note that as you add more levels, there’s more data to manage, more levels to look within and across, and there’s no guarantee more levels leads to meaningful or fruitful knowledge.
Having more than 3 levels in a multi-level mixed design quickly increases the complexity of your data analysis within levels, across levels, and for the system of levels.
The multi-level design is also unique in how you sample and recruit participants. You’ll almost always use two sampling techniques, one random and one non-random, together. Sampling for a multi-level mixed methods study is ultimately based on your unit-of-analysis. While this sounds complex, a unit-of-analysis is a simply who/what you’re collecting data from and the subject/focus of your analysis, findings, and reporting.
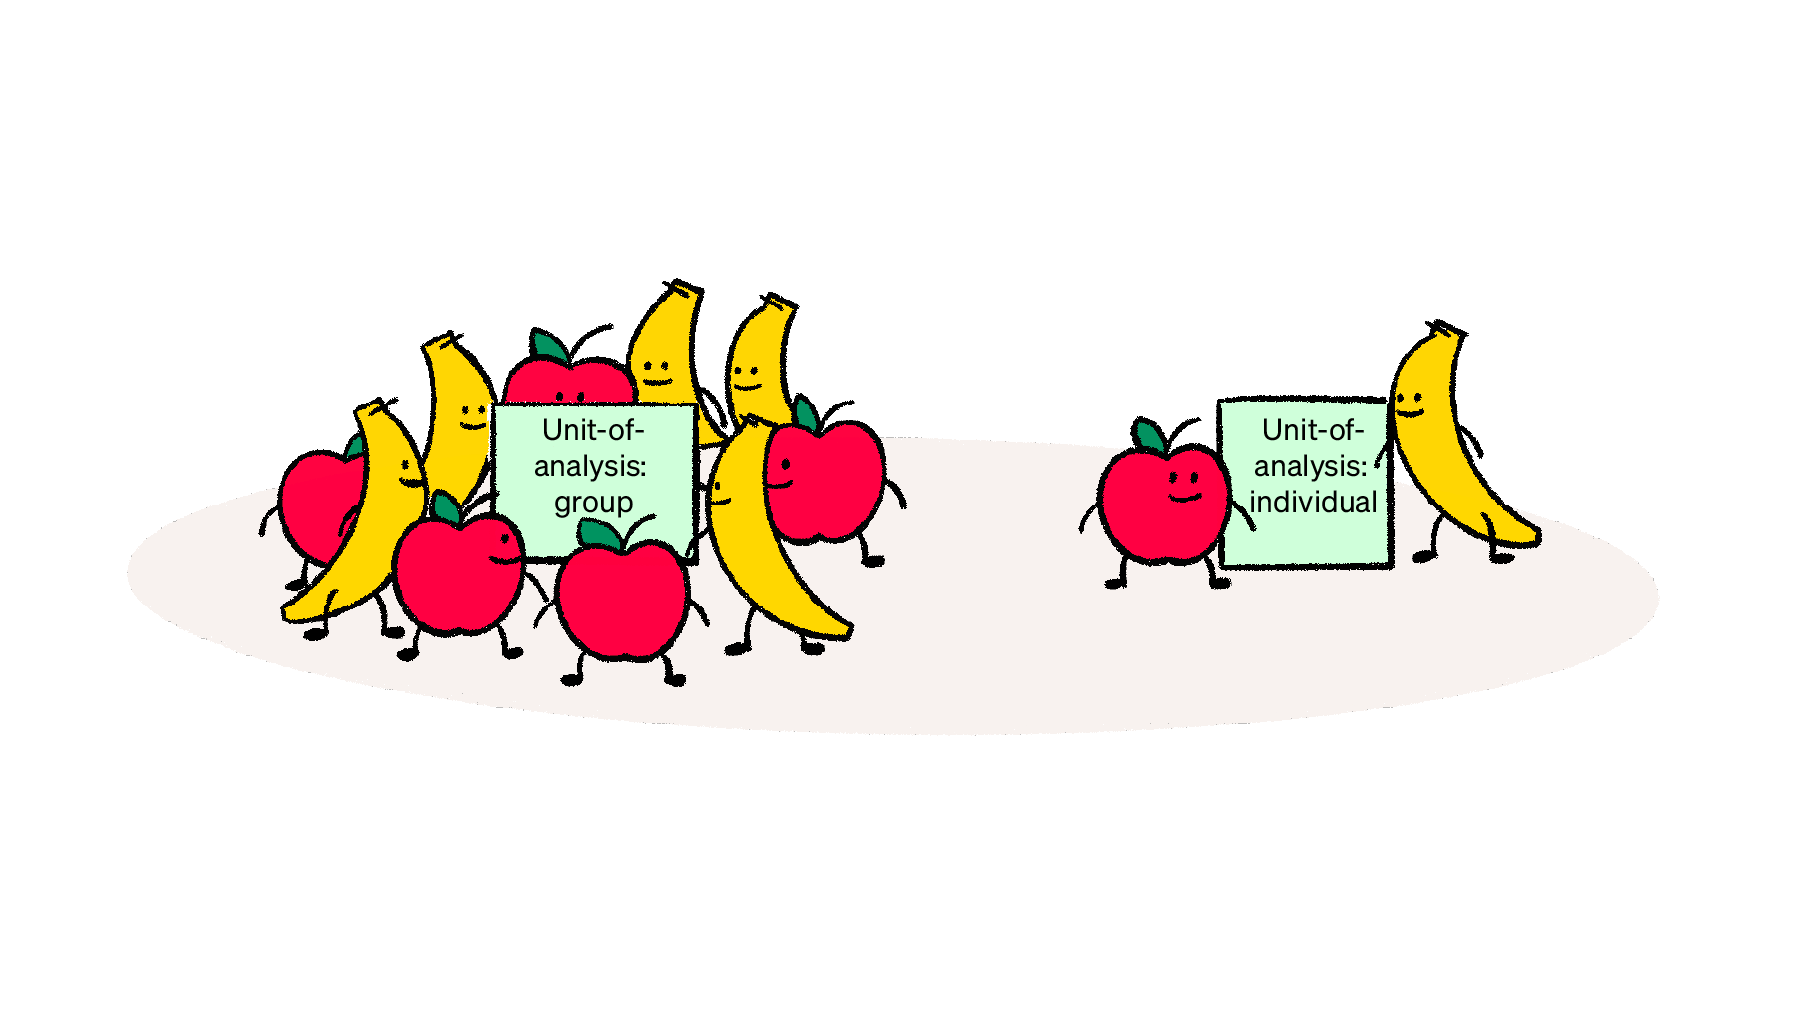
For a quick example, if you wanted to compare apples and bananas, the unit-of-analysis would at the group level (or groups of apples versus groups of bananas). But if you wanted two compare one apple with a banana (or two specific apples with each other), the unit-of-analysis would at the individual level.
While units aren’t set in stone, common units-of-analysis are at the individual, group, organization, or social artifact level. You can read more about the unit-of-analysis concept here.
The multi-level mixed design tend to have more than one unit-of-analysis.
In the multi-level design, quantitative data tends to be collected at a larger, broader unit-of-analysis (like groups or organizations). As such, you’d look to use random sampling to efficiently collect data from broad units. In diagram below, you could randomly sample delivery zones to capture delivery satisfaction scores for both drivers and customers.
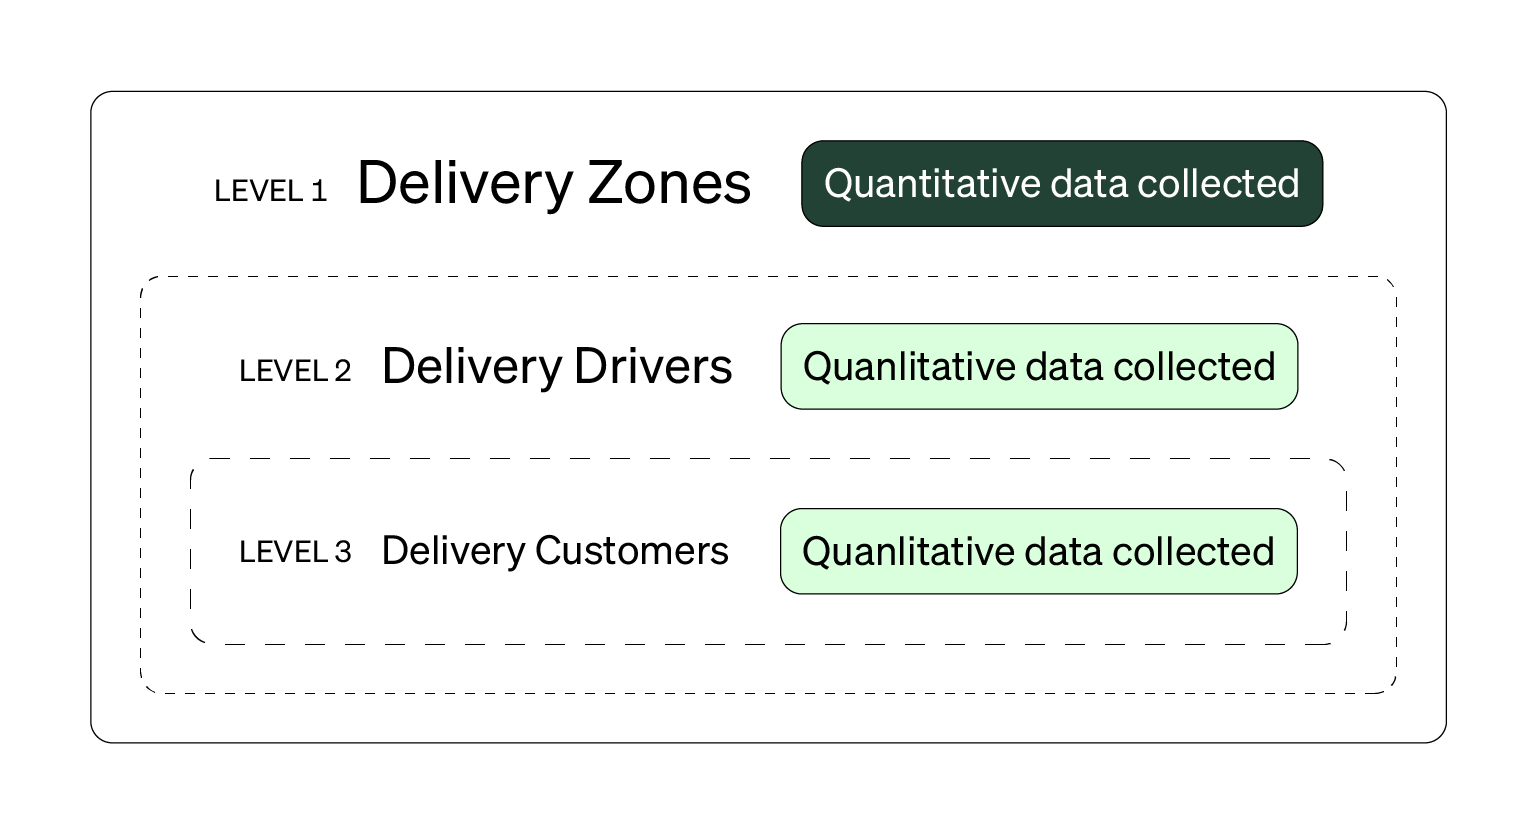
Qualitative data tends to be collected from a smaller, narrower unit-of-analysis (like individuals). You’d could use a non-random sampling technique (like chain sampling) to collect the qualitative data. You could interview highly rated delivery drivers and high frequency delivery customers to understand the satisfaction scores for both groups and as a whole. And with the two strand nature of this design, you can refine your sampling strategy for latter levels to maximize learning and resources.
The meta-inferences from a multi-level design are done across all of the levels. What’s true about the entire structure of levels (aka a system)? What’s true across some or all of the levels? If there are any contradictions or disagreements, how does the level of each subgroup or population influence or explain them? You’re trying to understand the structure and levels together, not individually. Additional findings within each level help explain larger, broader patterns about the system of levels.
You should consider a multi-level mixed design for complex systemic problems, especially those with multiple levels or groups of people.
Like other mixed designs, there’ll either be a qualitative or quantitative priority. In the delivery example, there’s priority given to the qualitative data that comes from the interviews. Other properties about the multi-level mixed design are shown below.
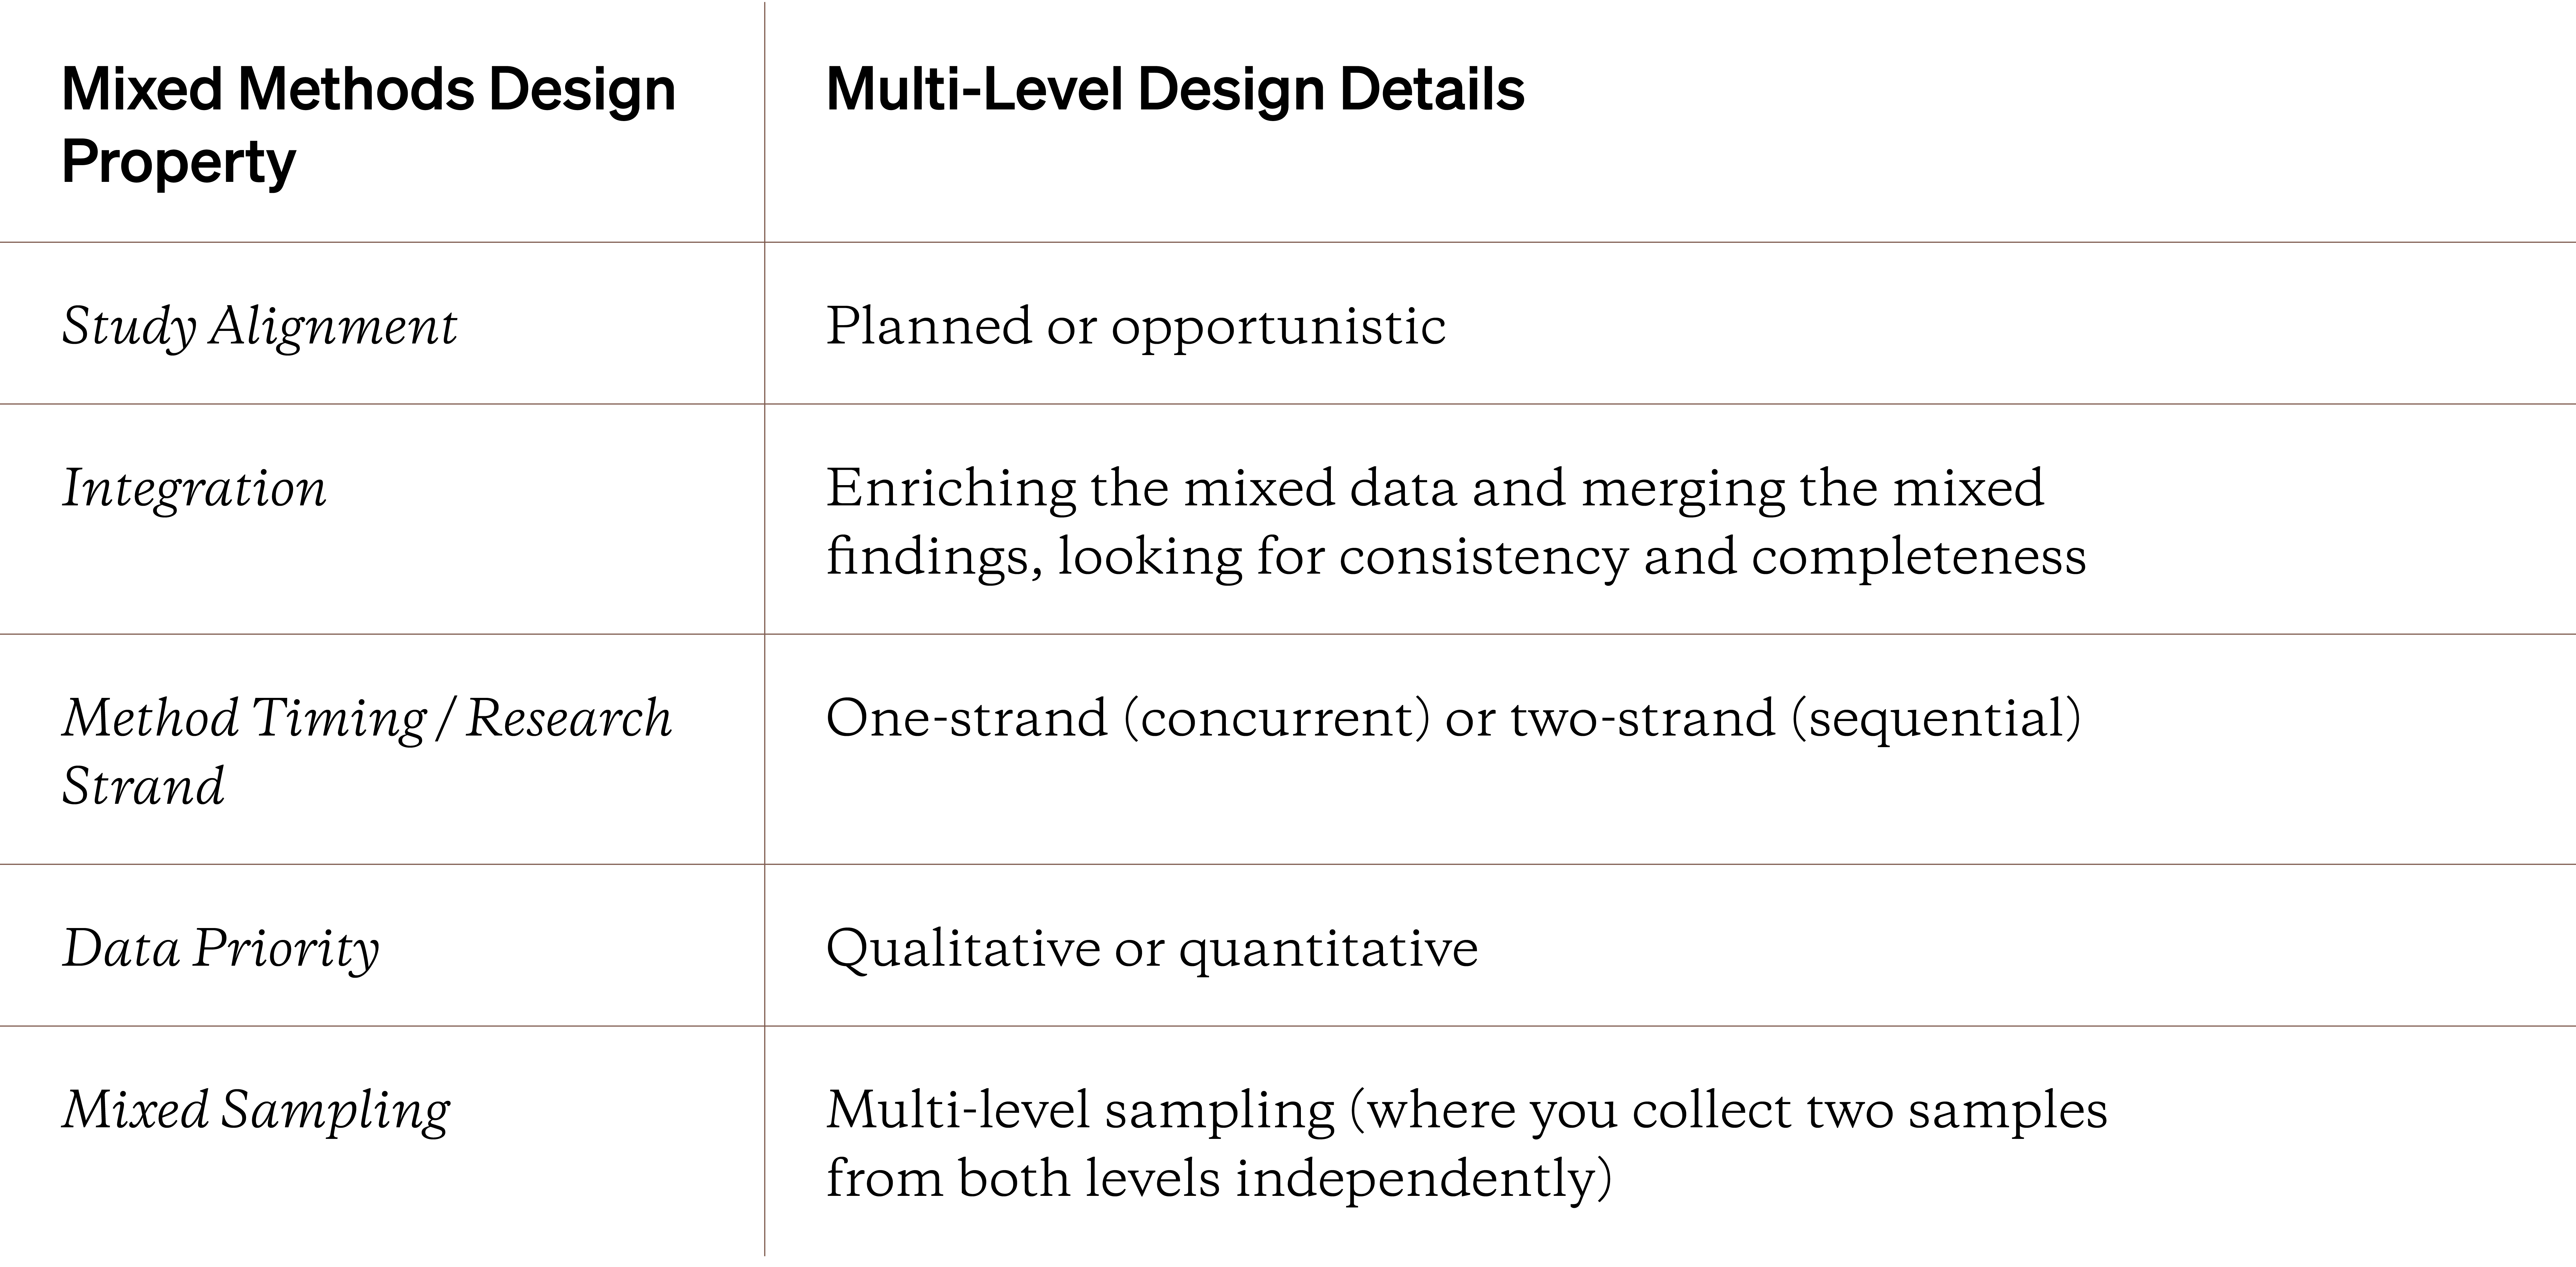
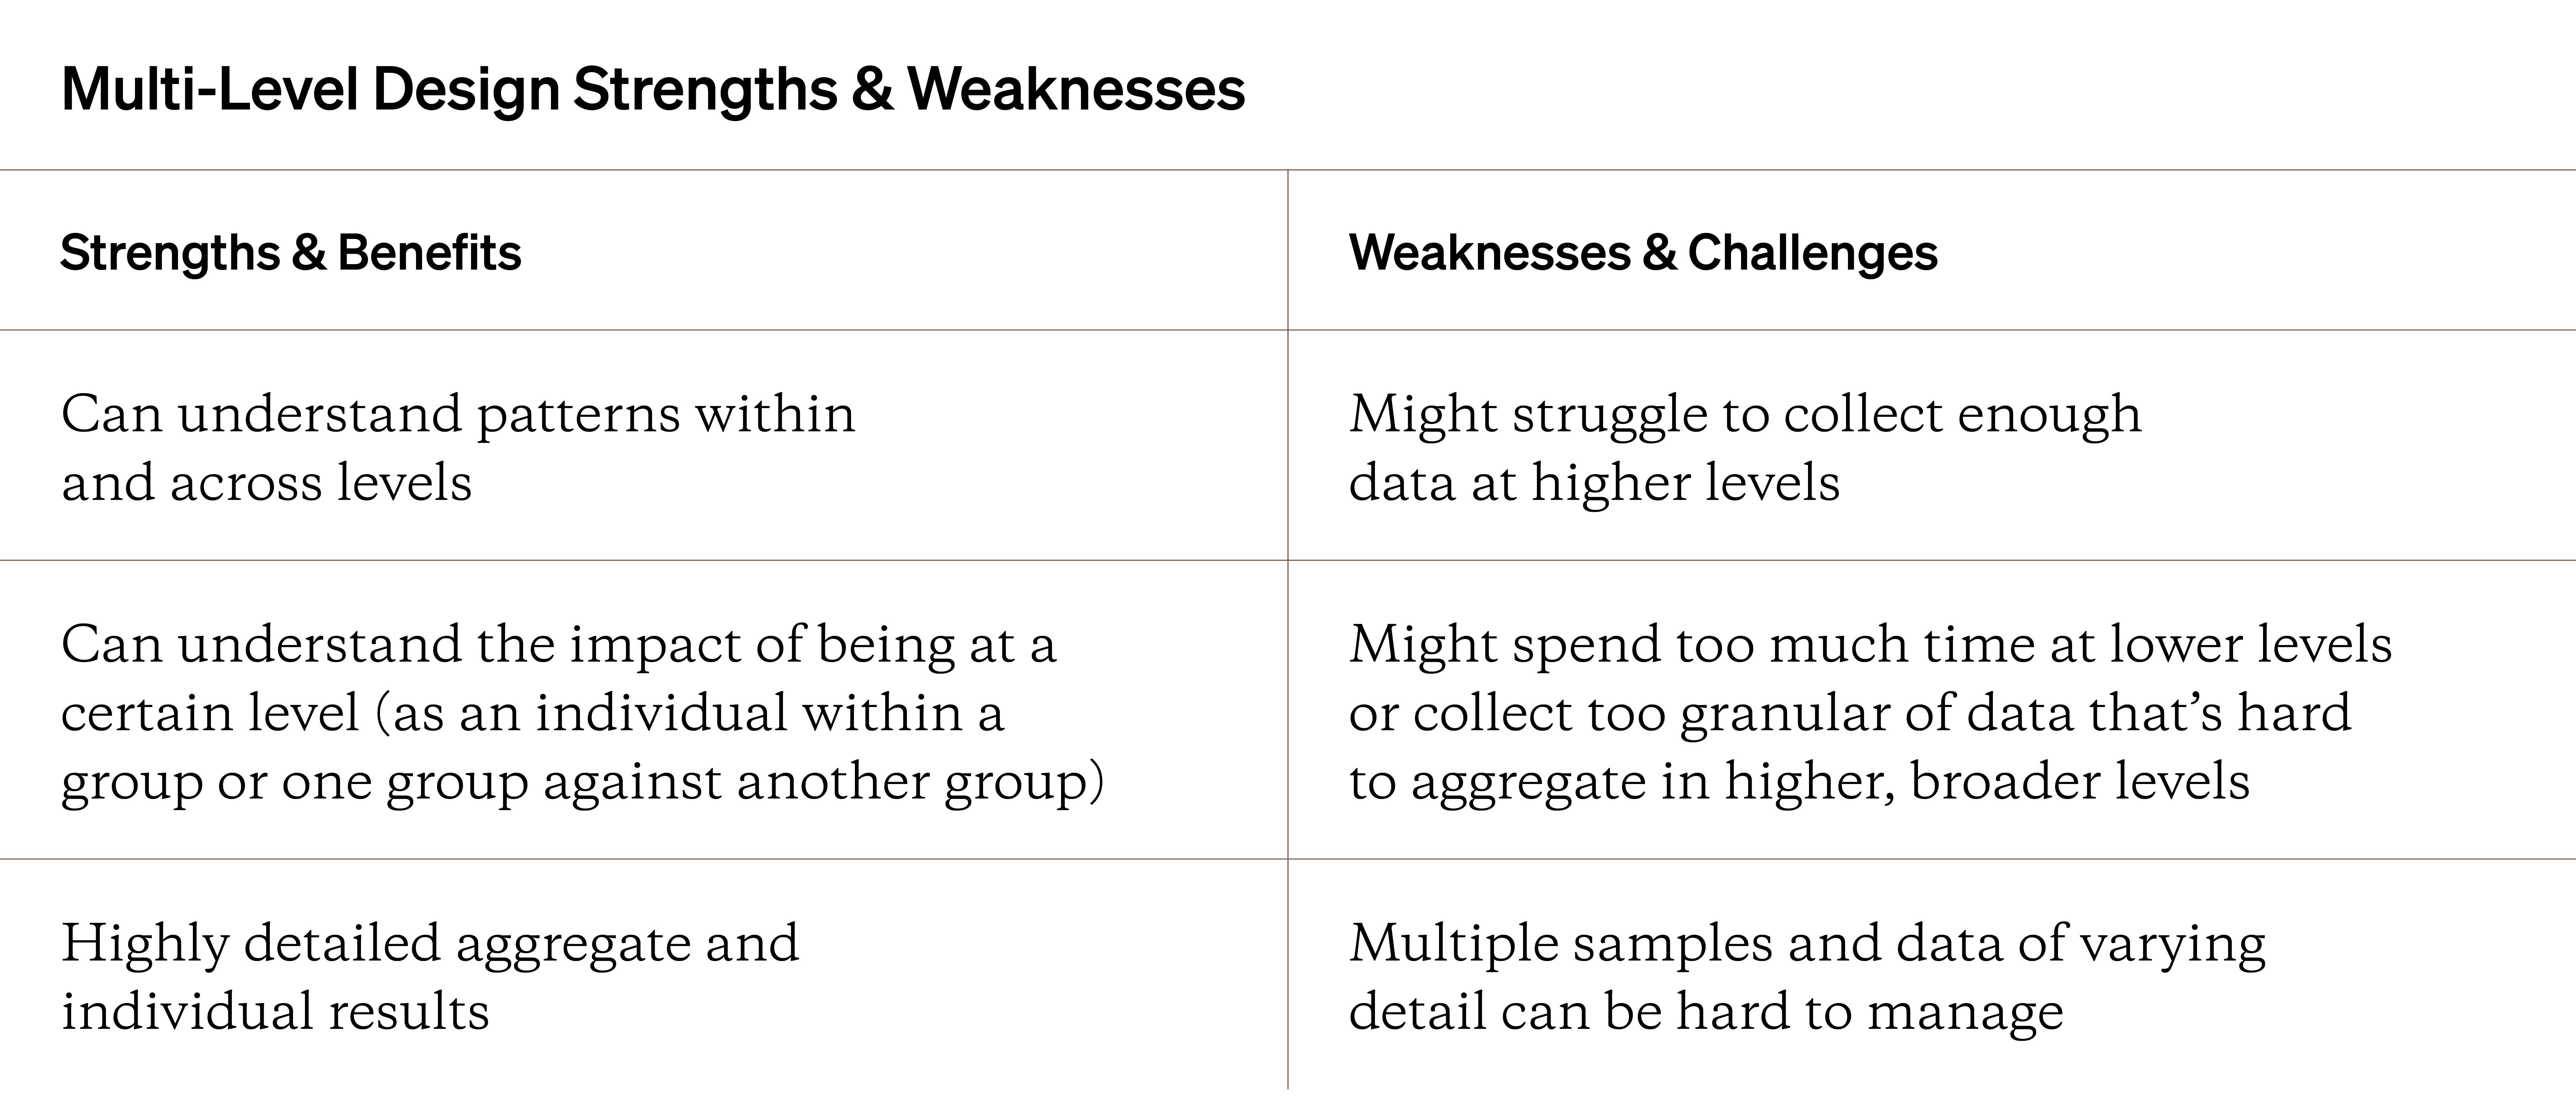
These properties and the nature of the multi-level mixed design lead to some unique strengths and weaknesses, shown below.
Once again, there’s a diagram visualizing the multi-level design and its many steps. Below is a list of behaviors and outputs for this mixed study design. Note that the diagram below is showcasing a one-strand design, where analysis and synthesis happen at once. For a two-strand design, there could be merging or enriching integration after each level is studied, instead of after all the levels have data collected from them.
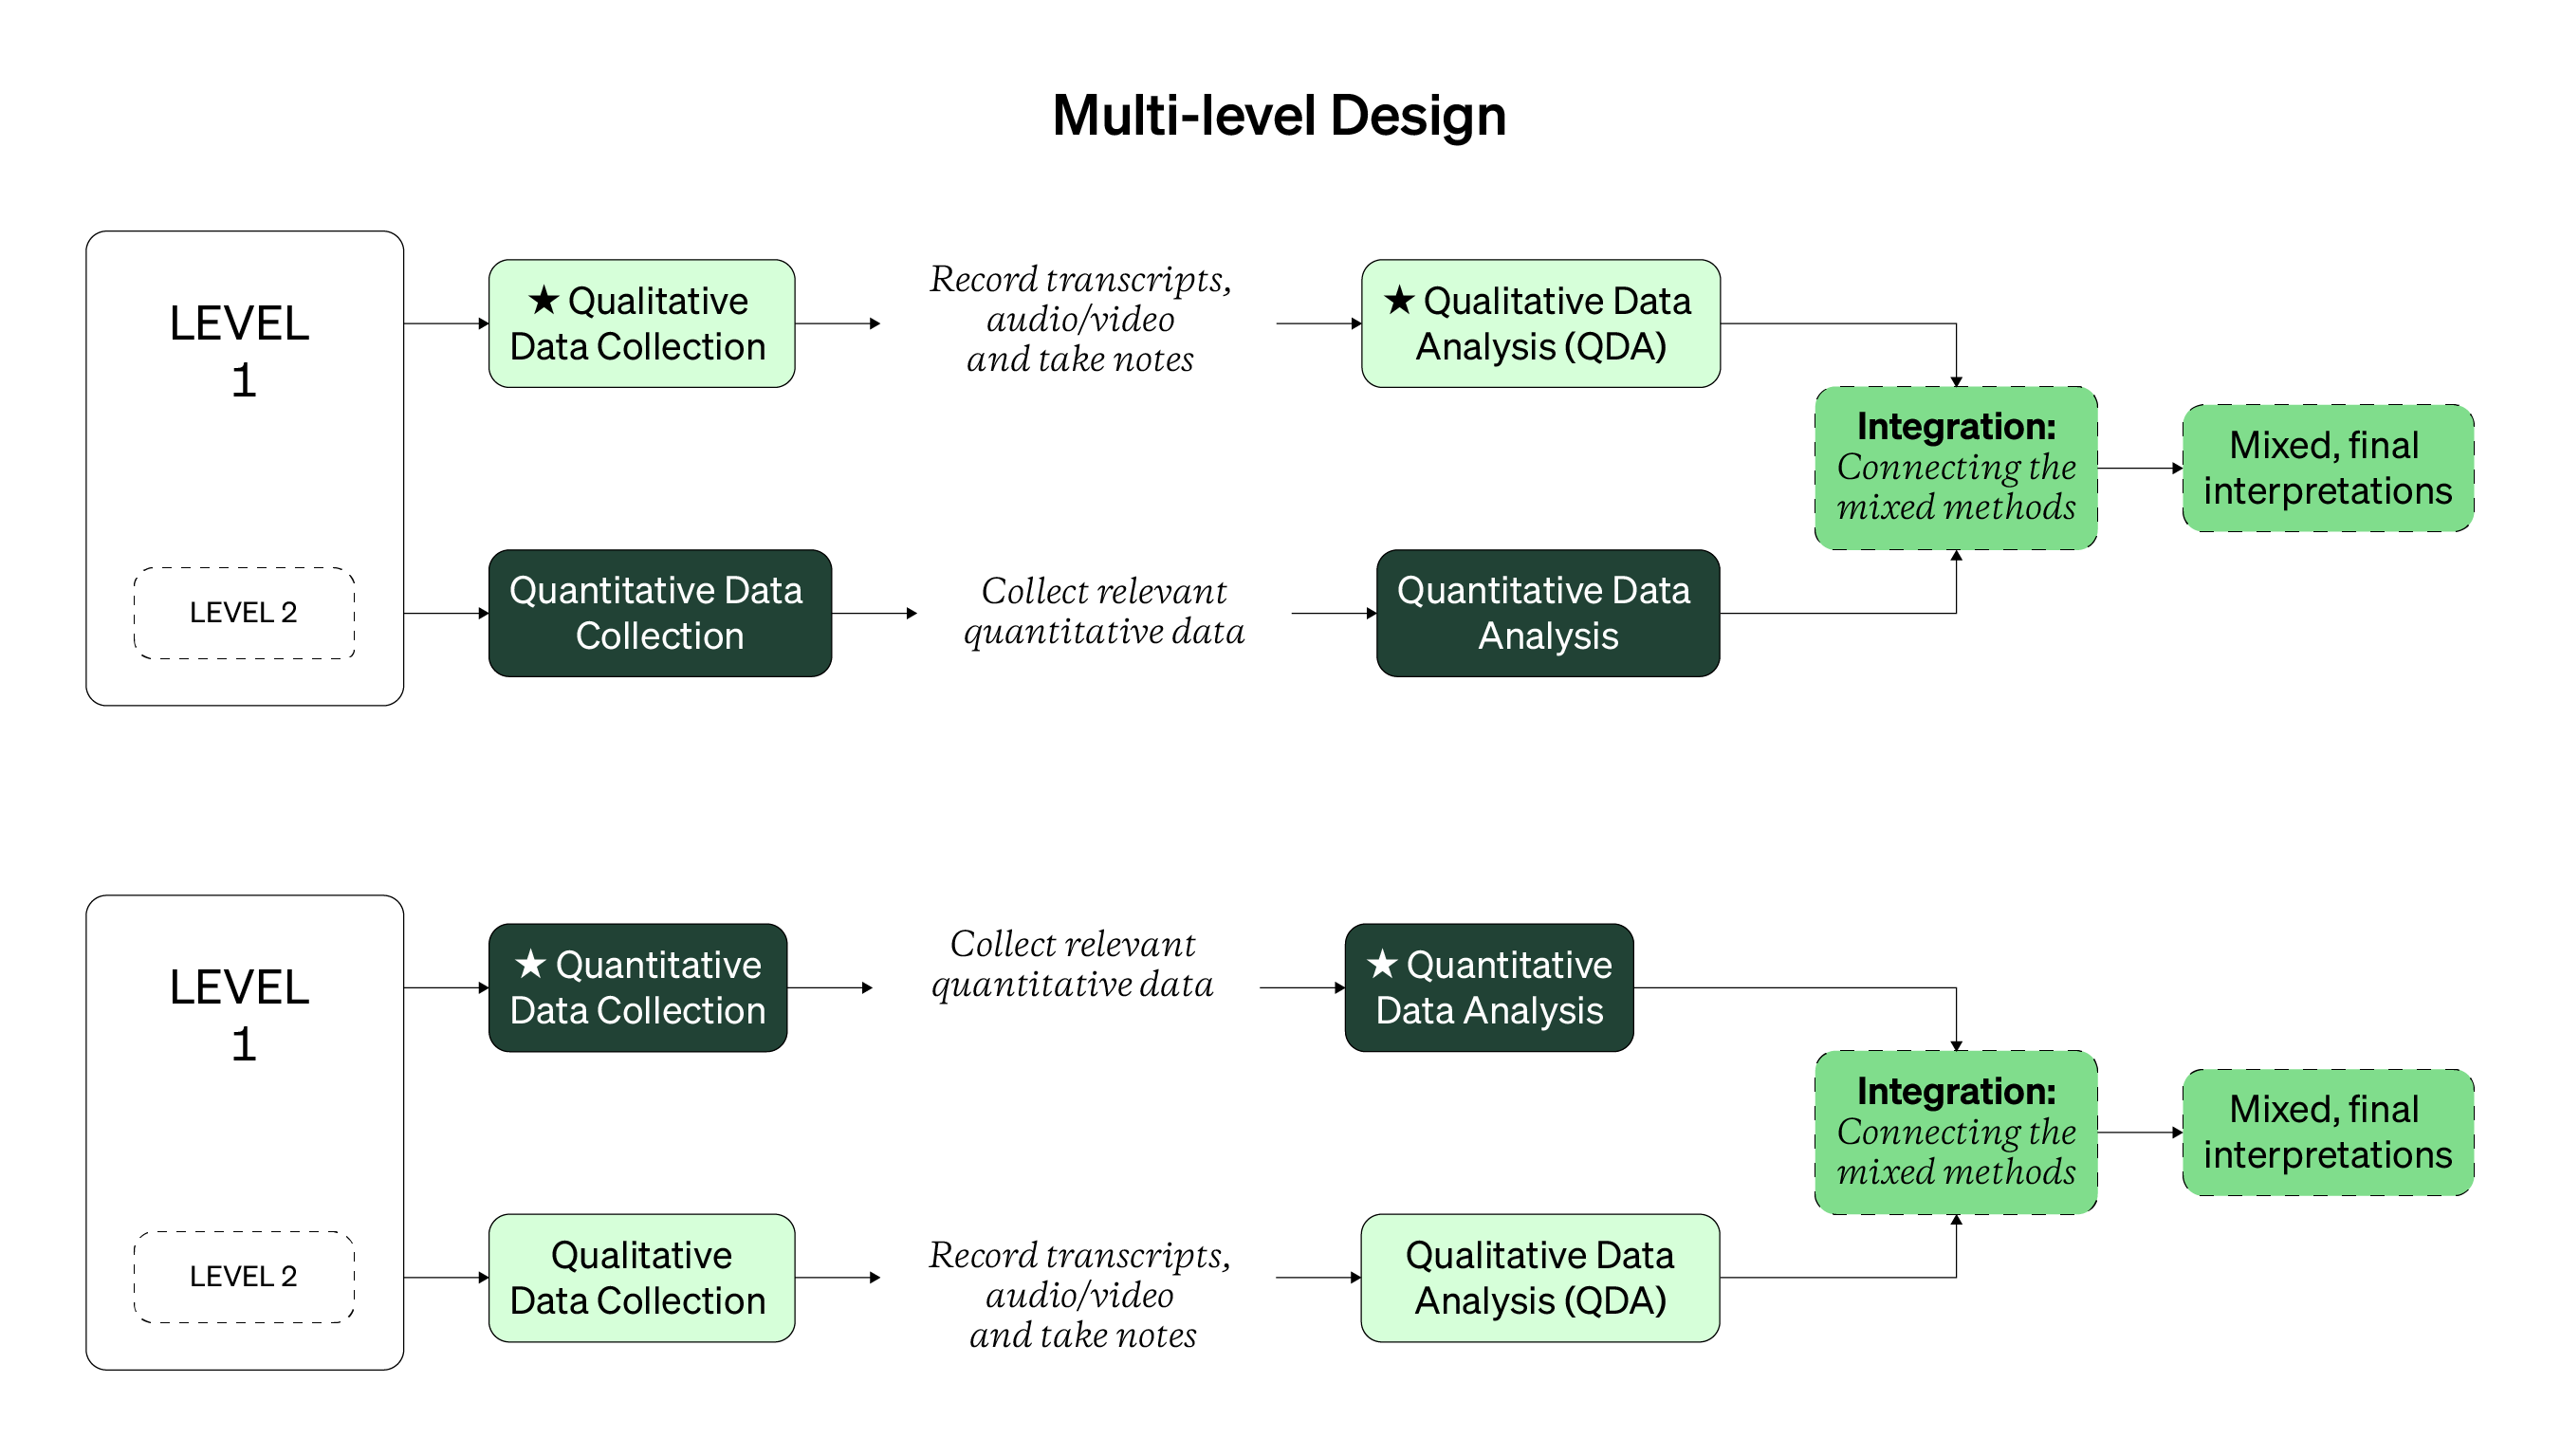
Multi-level Design Behaviors & Outputs
- Define the levels you want to study based on your research questions
- Define and recruit participants at each level
- Collect qualitative or quantitative data at each level
- Structure and analyze each set of data individually, by focusing your analysis within each level
- Arrive at qualitative and quantitative findings for each level
- Expand and deepen both sets of findings by analyzing and reviewing patterns across each level
- Arrive at a set of meta-inferences that hold true across all of the levels, based on your qualitative and quantitative findings
You can read more here in this multi-level study, this study or this study.
Let’s look at the final mixed design covered here: the nested or embedded design.
Enriching-Nested Design

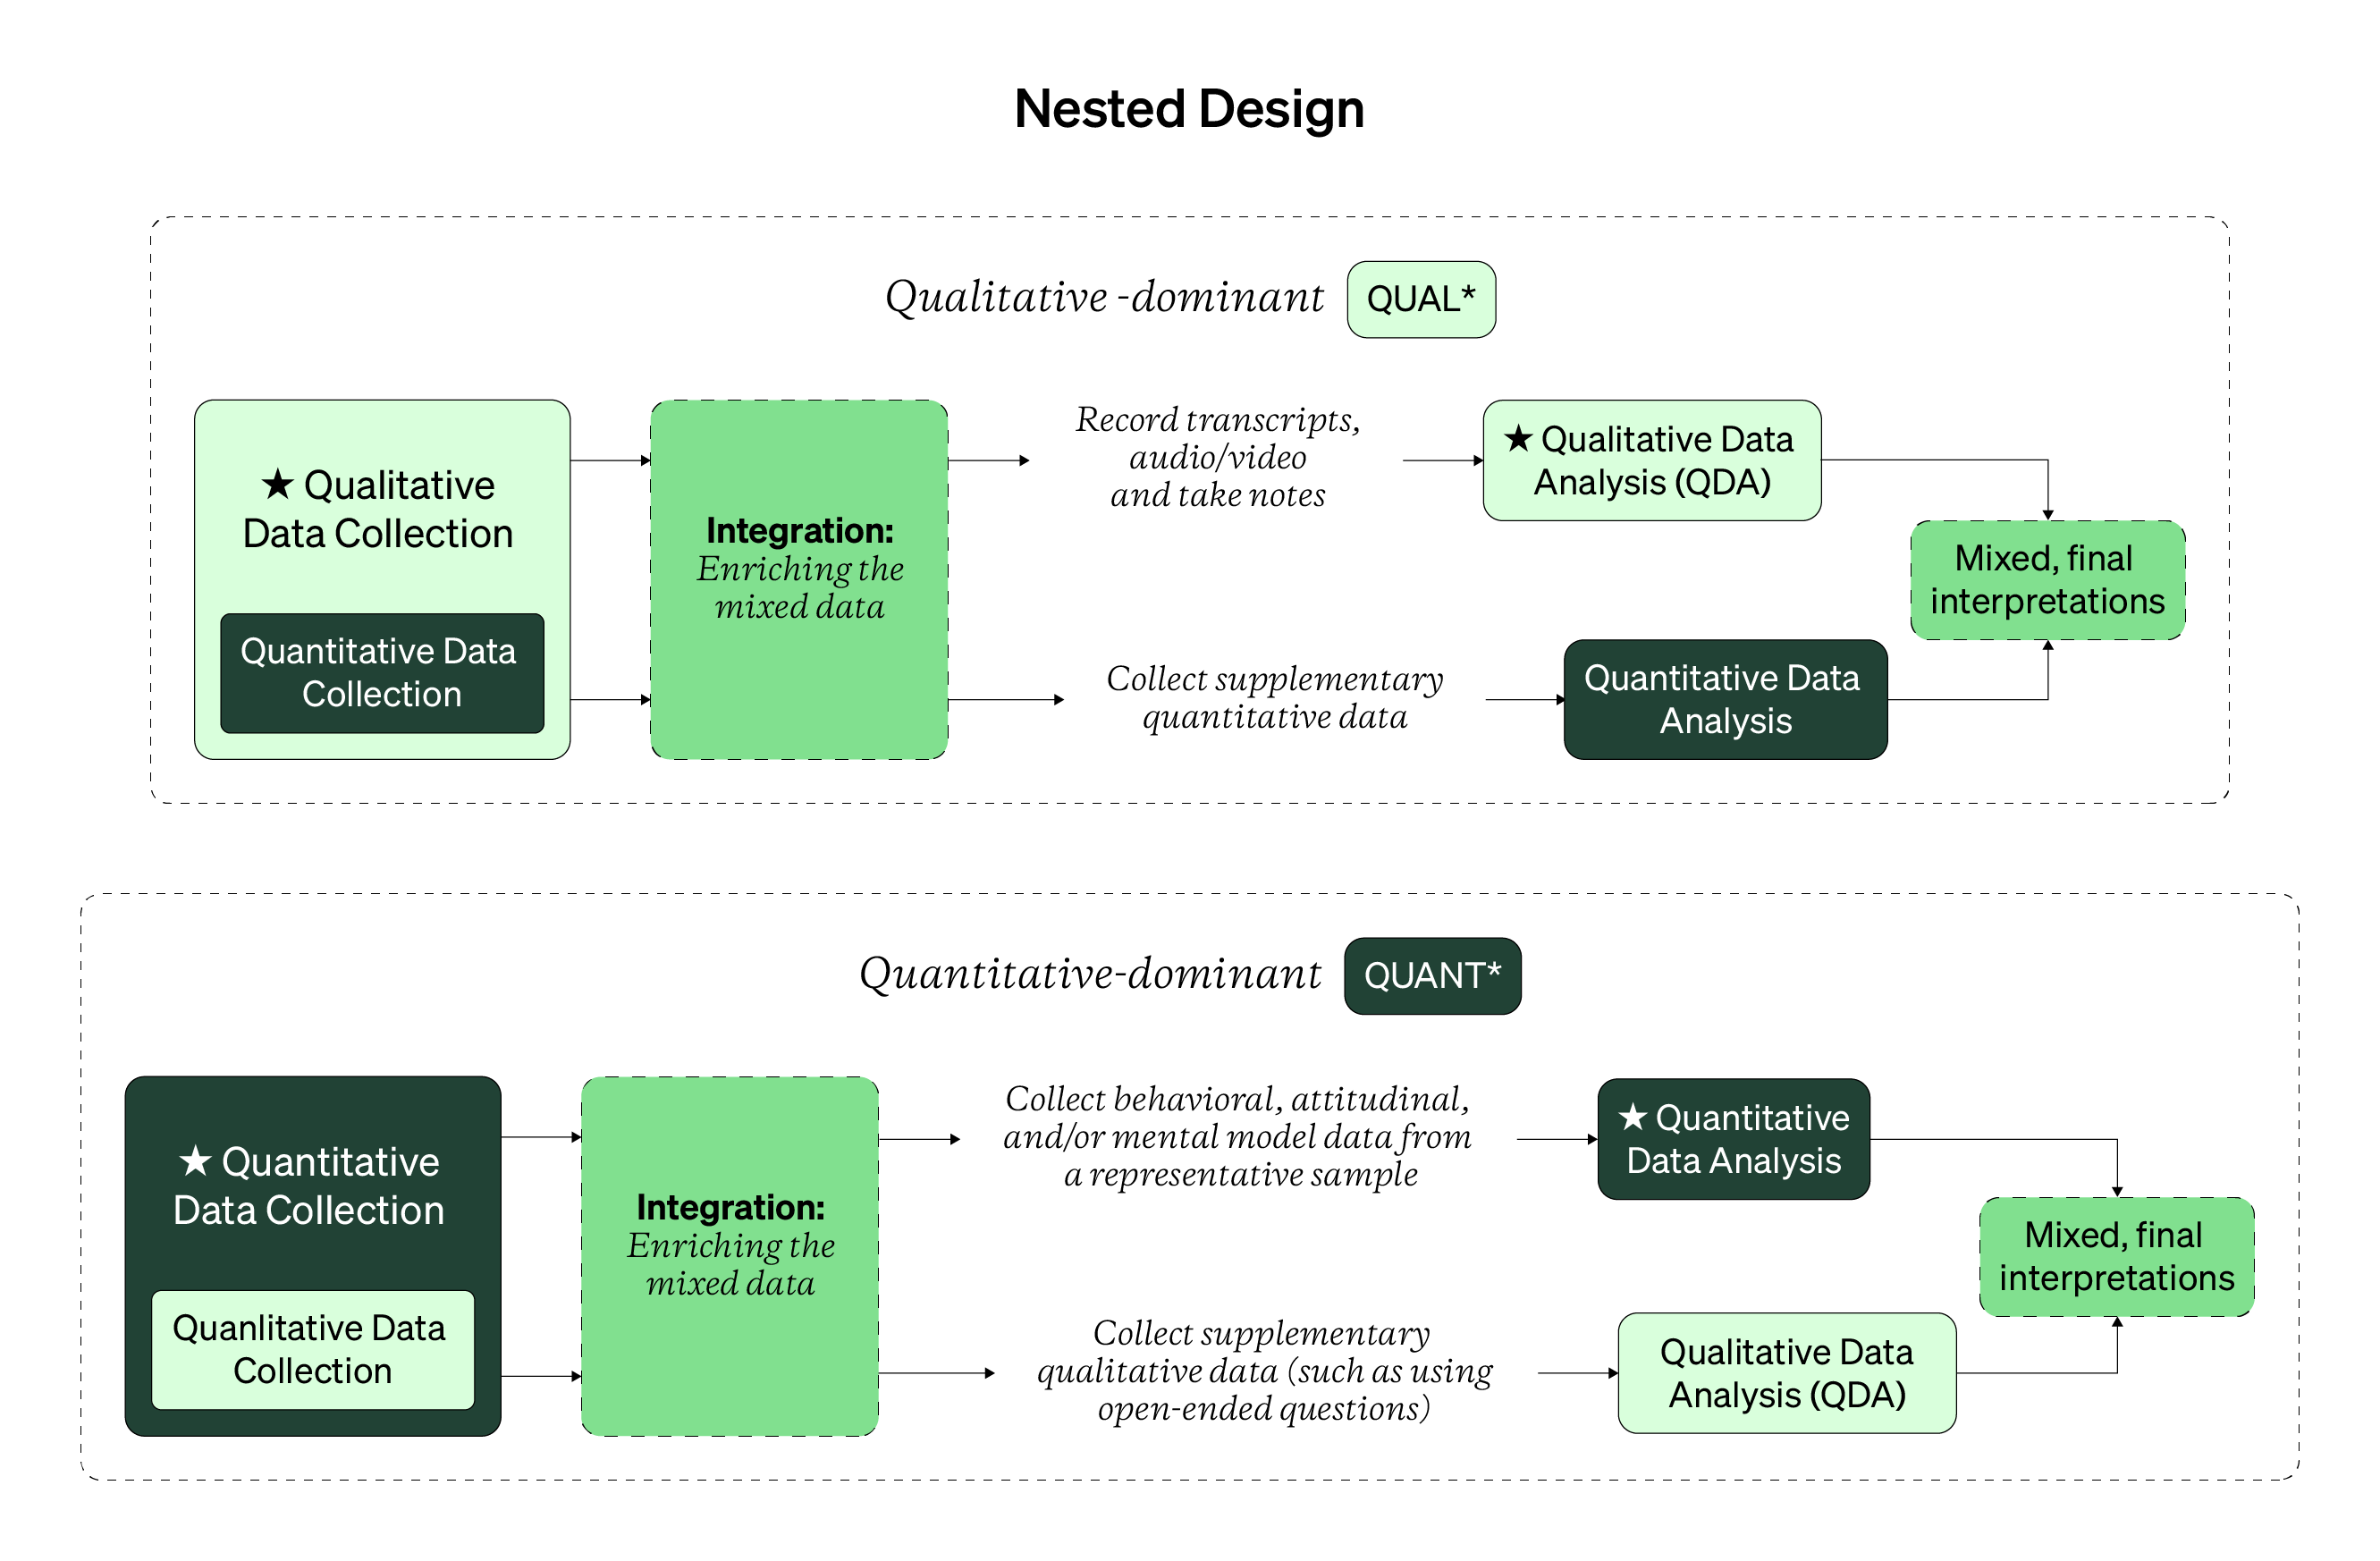
The final mixed design covered in this Handbook is the nested or embedded design. It’s a one-strand design, with one method or set of data being given priority over the other. The non-prioritized method doesn’t address the same research questions as the prioritized method but questions adjacent or related. It’s collecting complementary evidence around the same research topic.
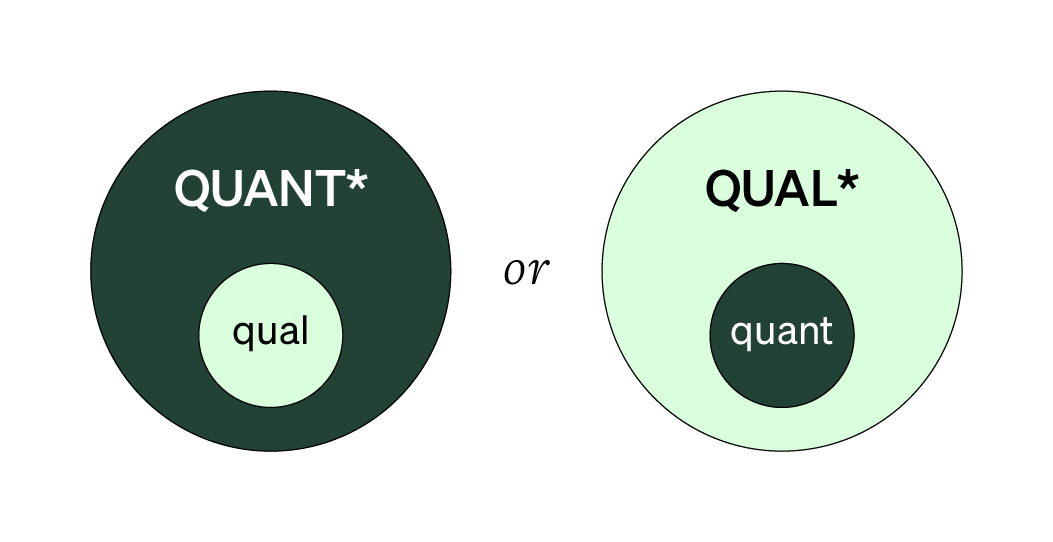
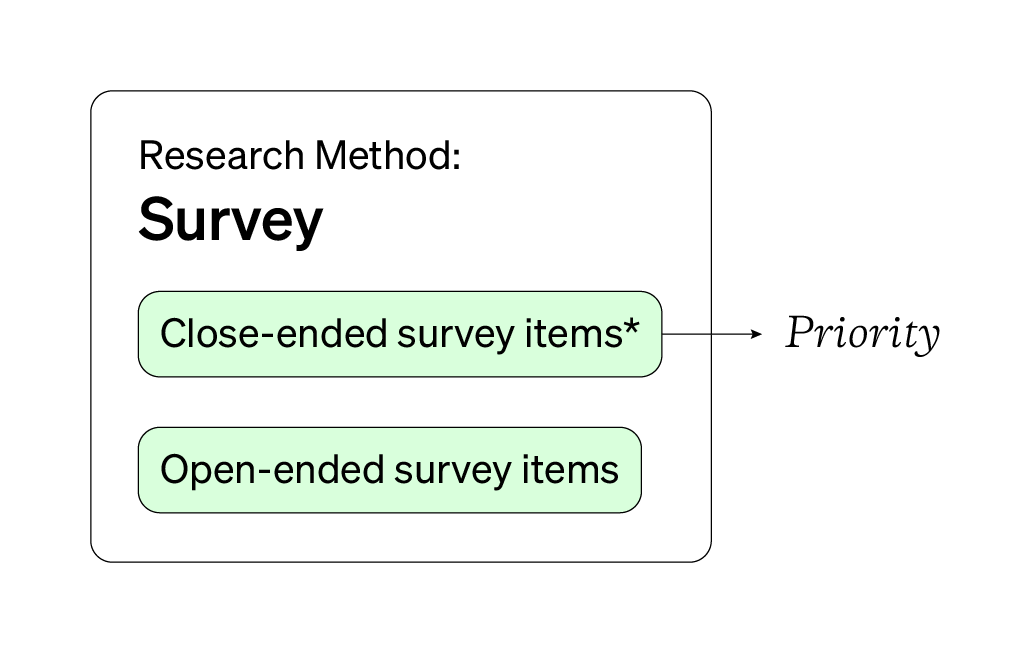
Nesting means collecting a particular type of data within or while using another method. Nesting tends to happen within the prioritized method. For example, you might prioritize quantitative, closed-ended survey data, while nesting a handful of related qualitative, open-ended questions.
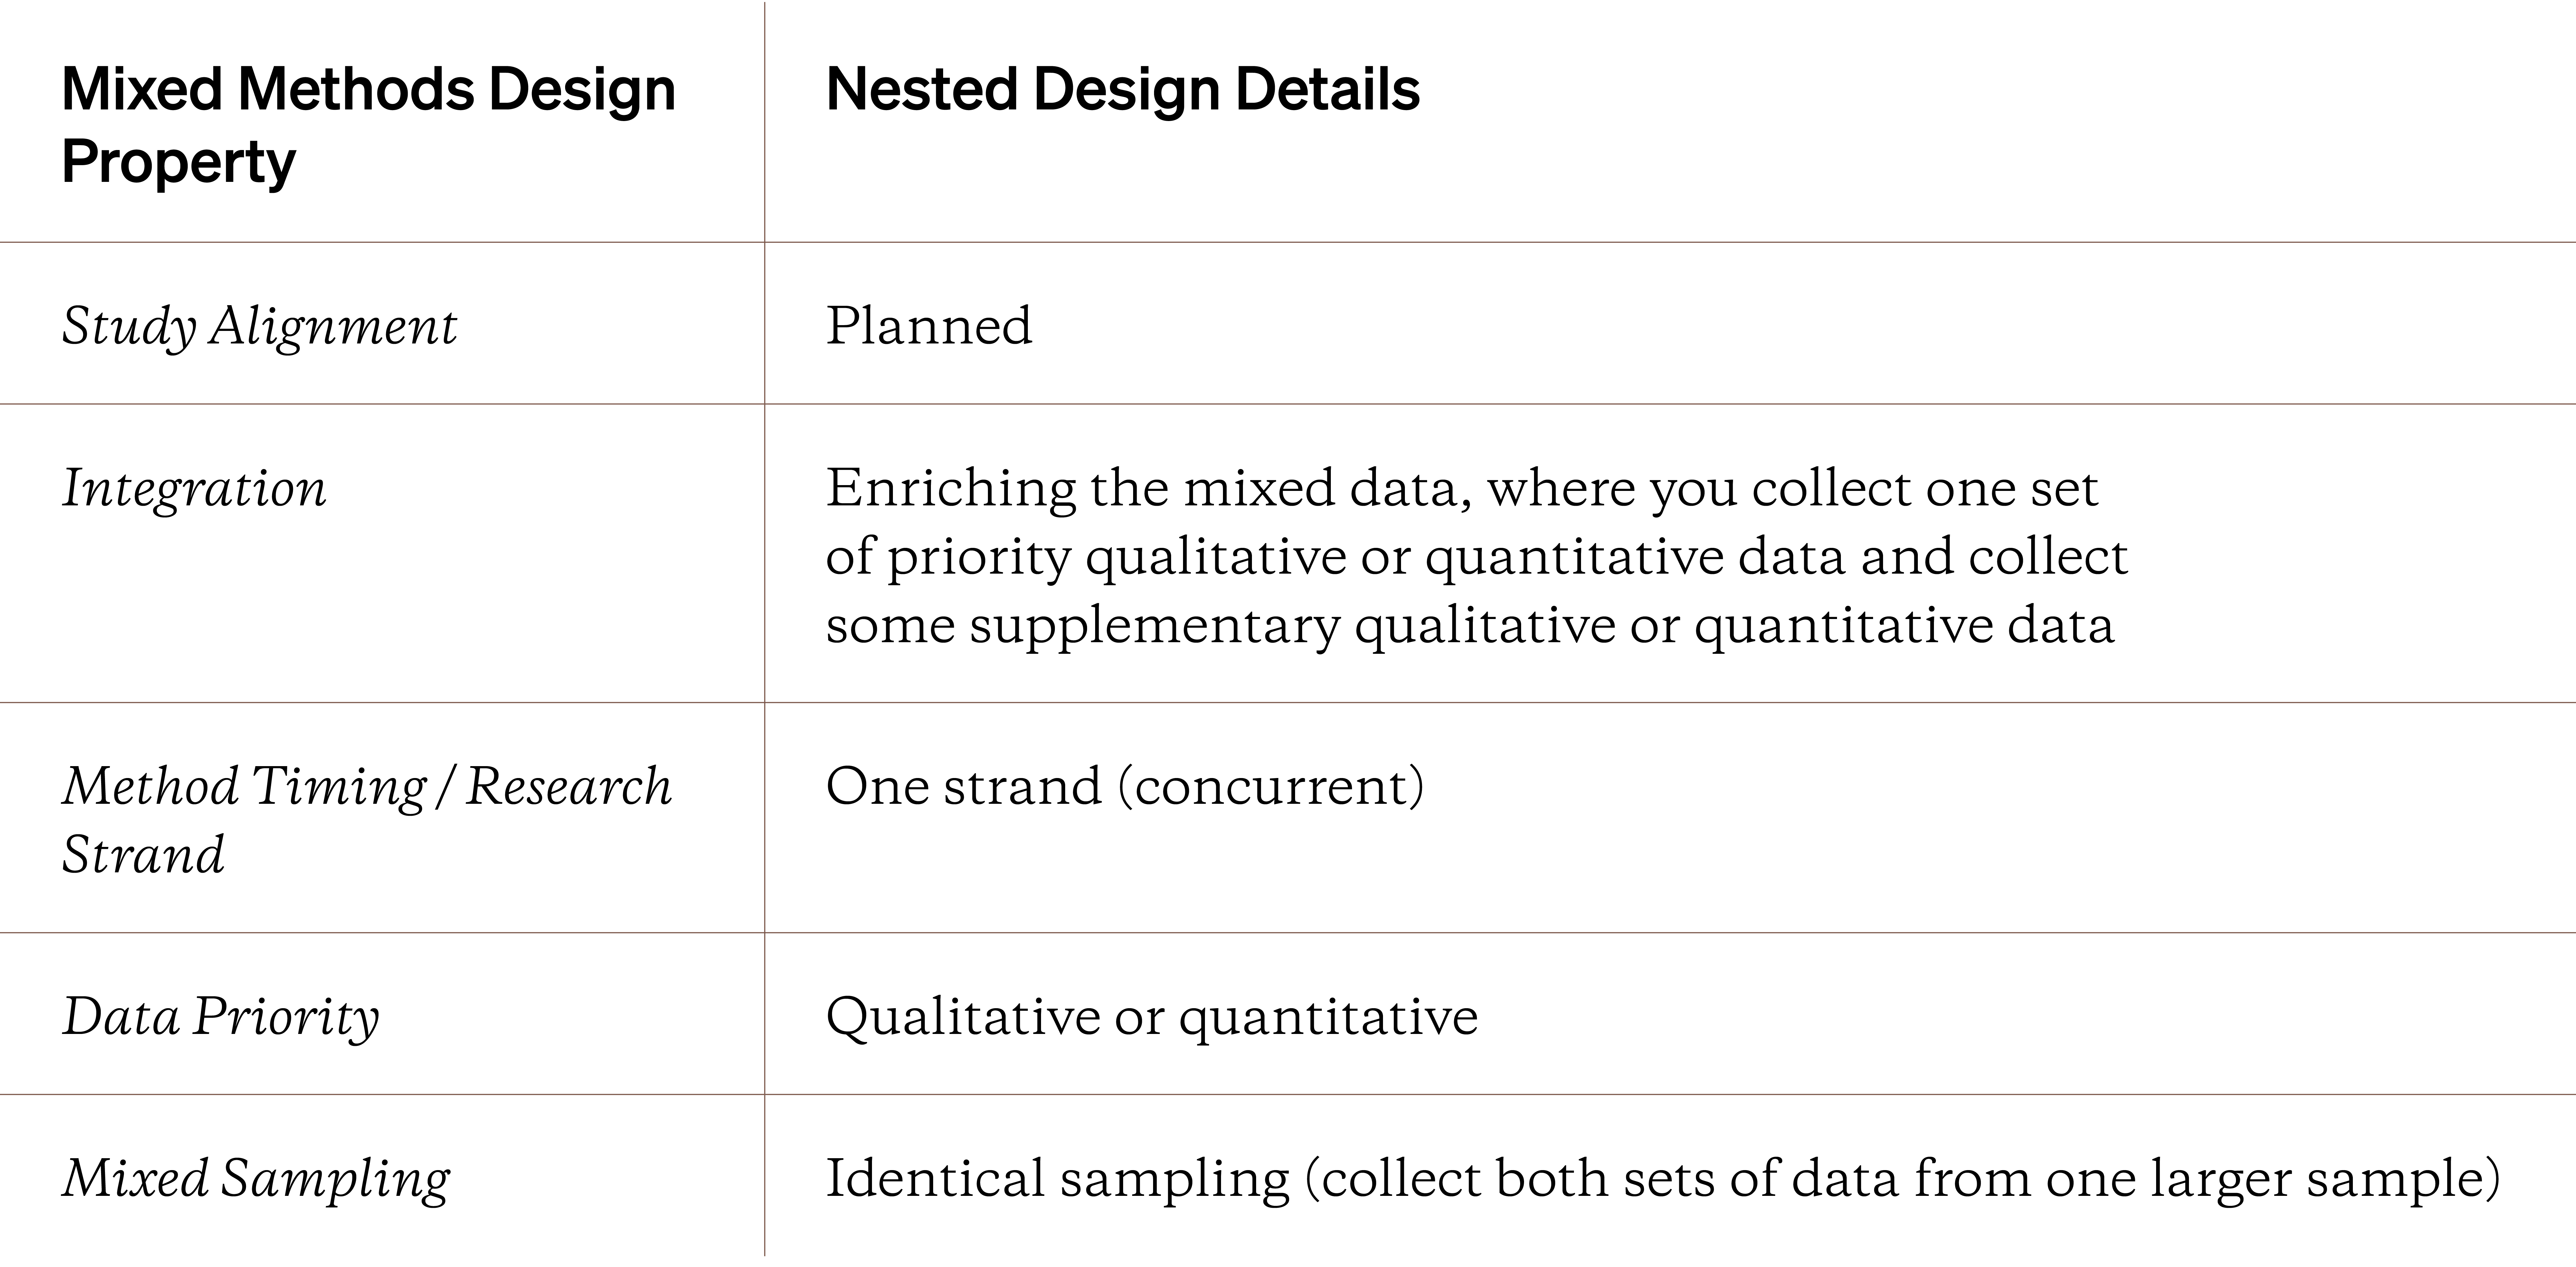
Both sets of data are analyzed and interpreted at the same time after they’re collected. The nested design is great when you have a specific, prioritized set of research questions and also want to understand different, interrelated aspects of that same topic.
The nested design has one set of prioritized research questions and another set of complementary research questions.
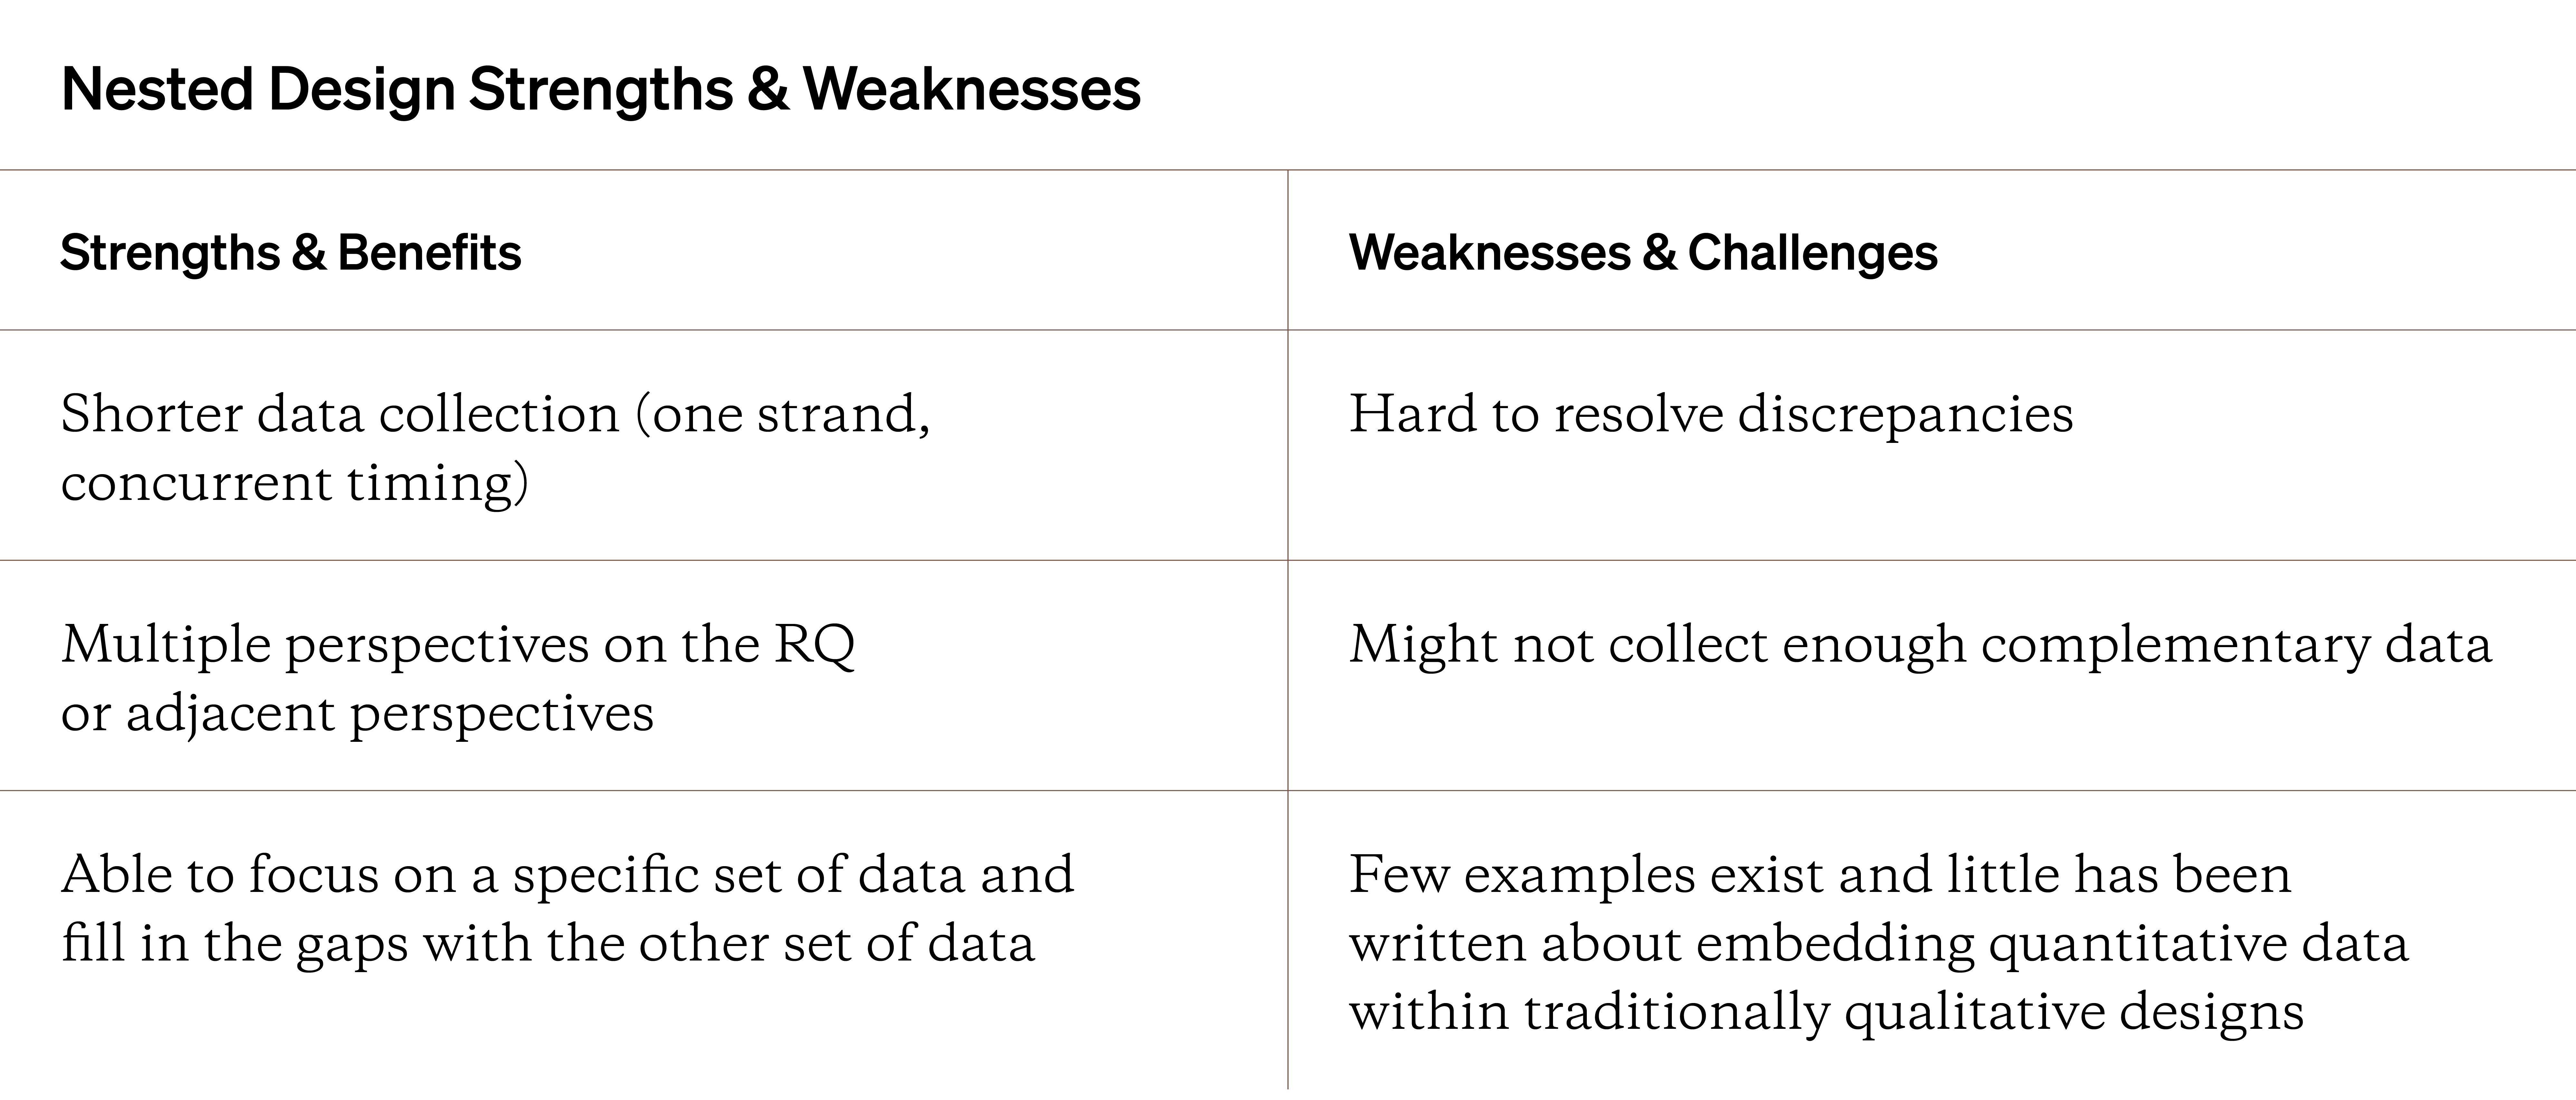
Use the nested mixed design if you have short study timelines or when one set of data isn’t enough. Similar to the concurrent triangulated design discussed above, you’ll still have to analyze all of your data linearly so make sure to budget enough or additional time to analyze properly.
In practice, many researchers apply the nested design when running a quantitative experiment. Either before, during, or after (or even at all three points), supporting qualitative data is collected. For example, if an experiment looks to measure how well a redesigned page affects time spent interacting with that page, you might qualitatively understand how people use that page today, what elements stand out on the page during the experiment, and how they felt using the page after the experiment concludes.
In this experiment example, the focus is really on the behavior (measured quantitatively in time spent in minutes, the number of clicks, the click path a person takes, etc.) with their qualitative interview feedback adding enriching data to make sense of the quantitative data.
For a qualitative-dominant approach, you could have interview participants complete a brief close-ended survey. Or during participant or field observations, you could use behavioral coding to quantify specific observations (like the number of times someone uses self-checkout or how many customers ask a sales representative for assistance).
Use the two tables below to review the properties, strengths, and weaknesses of this design. Based on your needs and constraints, the nested mixed design might be perfect.
Below are two visual walkthroughs of the many steps in a nested mixed design, with different data priority. Note that while the data is collected at one time, it’s during data analysis when the enriching integration really happens.
And finally, here’s a quick list of the behaviors and outputs you can expect from this kind of mixed design.
Nested Design Behaviors and Outputs
- Write a prioritized set of qualitative or quantitative research questions
- Based on the prioritized research questions, write a complementary set of qualitative or quantitative research questions
- Choose the prioritized research method and figure out how and when the non-prioritized data will be collected
- Collect both sets of data
- Structure and analyze both sets of data, with more focus and attention on the prioritized data
- Use the complementary data and its findings to enhance, expand, or explain the prioritized data and its findings
- Arrive at prioritized findings, with relevant complementary findings for each set of research questions
To learn more about the nested mixed design, check out this example study, this YouTube video, or this presentation.
Final Tip: Choose the Simplest Mixed Design Possible
With so many designs and variants, you might accidentally choose a design that’s overly complex. But the final advice is simple: based on your research questions and constraints, pick the simplest mixed methods study design possible. Adding more complexity or variables to your mixed methods studies doesn’t guarantee better findings, but it can definitely increase the chances that careless mistakes get made. Look at your research questions, your available research methods, and your timelines to narrow out which approach is best for you.
More complex mixed methods studies can lead to careless mistakes, errors, and difficulties.
A pure qualitative or quantitative study might be perfect. If you don’t need to mix methods, don’t! Mixed methods research is more complex and challenging to prep, conduct, analyze, and report so be intentional about why you want to use a mixed methods research design. For more help, check out the guide below on figuring out what type of design would be most beneficial for your needs.
Guide 19: Choosing a Mixed Design
Closing Thoughts
Topic 3 and Topic 4 in this mixed methods research handbook showed you a wide range of powerful mixed designs. Choosing the wrong design can lead to unsolvable headaches. However, like with all things research, you can become better at recognizing the simplest mixed design necessary for your needs. One place where headaches can happen is when you go to analyze your mixed data. How do you make sense of the qualitative and quantitative data you’ve collected? Do you analyze it separately or together? In the final Topic in this Handbook, let’s take a closer look at mixed data analysis.
- Unit of analysis; unit of observation; unit of inference; unit of generalization
- Concurrent (triangulation) design
- Multi-level mixed methods design
- Embedded design; embedded experimental design; embedded correlational design
- "Mixed Methods Research" by Daphne Watkins and Deborah Gioia (paid book)
- "What is a unit of analysis?" (webpage)
- "Understanding Different Issues of Unit ofAnalysis in a Business Research" (article)
- "Designs for Mixed Methods Research" (limited chapter)