


Representativeness Isn’t Fixed or Perfect
Let's start with honesty: You can never have a perfectly representative sample. Unless your sample includes your entire population (commonly known as a census), you’ll always tolerate some difference between your sample and your population or segment of interest. Some of your samples will be more or less representative based on your study design, research questions, and study goals.
The simple fact that you're studying only a part of a larger, complex segment means there'll always be a difference between your sample and the segment. If your sample is small (say less than 30 participants), that difference between the sample and population would be very big. But if your sample size is very large (say larger than 10,000 participants), then that difference would be smaller.
Representativeness also isn't one fixed, static idea but something that changes based on your research question. Even if you’re studying the same segment, you might need different characteristics or proportions for your sample composition to be viewed as representative.
Representativeness also isn't one fixed, static idea but something that changes based on your research question.
For example, let’s pretend that there are exactly 500 fruits on Research Island. If you care about knowing how enjoyable the local parks are, you might use “park membership” when recruiting participants to make sure you get the correct amount of day-pass non-members, month-to-month members, and yearly park members in your sample.
But if you cared about knowing what changes should be made to the regional basketball court, then the variable you use to assess representativeness might be basketball club membership instead.
So, how do you check for representativeness?
Checking for Representativeness
It starts with how you define your segment. Where do all of your Most Informative Participants live? How many of them are there? What characteristics, tendencies, emotions, and experiences do they all share?
Suppose you define your population too narrowly ("all people who are left-handed, who've voted in the last local election, who like mint chocolate chip ice cream"). In that case, your population will be very small. Your sample might be representative, but your stakeholders probably won't find your niche learnings very valuable.
You also have issues if you define your population too broadly ("all people that have this problem"). In that case, your population will be big and vague. Unless you have a large sample size, your sample will never be considered representative or even valuable.
Be honest with how you've defined what the population is. Try to define representativeness in a way that’s relevant to your study goals and in a way that you can reasonably check. Suppose you can access product analytics and see that 70% of all people who use your product are apples and 30% are bananas. In that case, you know who and how many people you need in your sample.
While this example is simple, demographic variables alone aren’t enough to guarantee representativeness. Unless your focus is actually building different experiences for different demographic segments, you'll need to include segments, emotions, behaviors, and more to check for representativeness.
Think of yourself as a detective, slowly gathering clues to see how more or less representative your sample is.
Other ways to assess representativeness are listed below. Think of yourself as a detective, slowly gathering clues to see how more or less representative your sample is. If there's not much evidence, then you'll want to inform your partners that what's been learned might not be generalizable to the larger population.
Ways to Assess Sample Representativeness
- Checking for differences between known population/segment values (ex: see if you have 30% iApple owners in your sample as expected)
- Seeing if a random sample came from a biased sampling frame
- Using the chi-square goodness-of-fit test
- Balance or weight your sample (see more below)
You, the researcher, must take in your data, interpret it, and finally judge how representative your sample is. The concept of representativeness in qualitative research is based on your expert judgment, while in quantitative research, it’s based on how you sample, the size of your sample, and how similar is your sample composition to your population on relevant characteristics.
For quantitative samples, you can use something known as the chi-squared goodness-of-fit to assess representativeness mathematically. Keep in mind, you’ll still have to interpret the test’s outputs and make the final judgment for or against representativeness. You can read more about the chi-squared goodness-of-fit test here or about the chi-squared test in general in the guide below.
Guide 12: Using the Chi-Squared Test
There are also ways to create or transform an unrepresentative sample into something more representative (an idea covered at the end of this Topic). However, your goal should always be recruiting or contacting enough participants to have a representative sample before you collect data. Your subsequent analysis will not only be faster, but you’ll also deal with lower errors in your calculations. This might mean oversampling or trying to reach certain sub-groups within your segment to make sure they get represented in your sample.
Representativeness vs. Generalizability
A common aim in quantitative research is a generalization, where findings from your studied sample also hold true for your population or segment of interest. You can easily make a “representative” sample by knowing certain characteristics of your segment of interest and then sampling participants until you hit those proportions.
For example, if you know roughly 30% of your segment-of-interest drive electric vehicles, you can ensure that roughly 300 out of 1,000 survey respondents fit that trait. But this doesn’t automatically mean your findings will generalize to your population or segment.
While findings from the representative sample are likely more generalizable than an unrepresentative sample, you must first use some form of random sampling. Your sample composition, the sampling frame you recruited from, and the sampling technique you used to get that sample all also affect your sample’s representativeness.
But there’s a catch: even if you use random sampling from a representative sampling frame and obtained a representative sample, your findings can only be generalized back to the sampling frame. Your findings can’t be generalized back to your larger segment of interest because not everyone from that segment is included or contactable in your accessible sampling frame.
And if you had lots of non-response (meaning some people didn’t or couldn’t participate), you can only generalize to participants who responded, making your generalizations even harder to accept. It's not perfect but experience research is about learning and improving the product for betterment of those that need and use it, not to only arrive at broad-sweeping generalizations.
Let’s end this Handbook by understanding sample weighting, a method for transforming an unrepresentative sample into something that mimics your segment of interest.
Sample Weighting or Balancing
Your sample never fully matches your population unless you use some form of random sampling. Even then, it's possible that enough people don't participate in your study, affecting how representative your sample is.
It's also possible that your sample under or over-represents certain groups from your segment due to uncontrollable, unseen factors. If your sample is not very representative of your segment, you might need to try sample weighting.
Sample weighting is a way of transforming the proportions in your sample so that they match known or expected population characteristics. You calculate weights and then multiply the weights by your data. This weighted data should give you a more representative look at what’s true at the population or segment level.
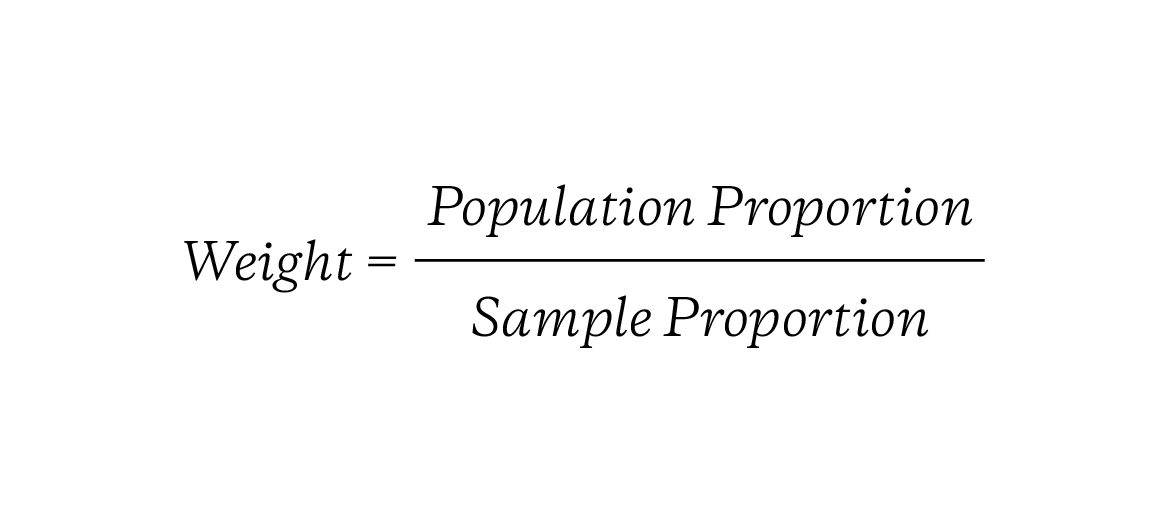
The formula for weighting is to divide the known/expected segment-of-interest proportions by your observed sample proportions.
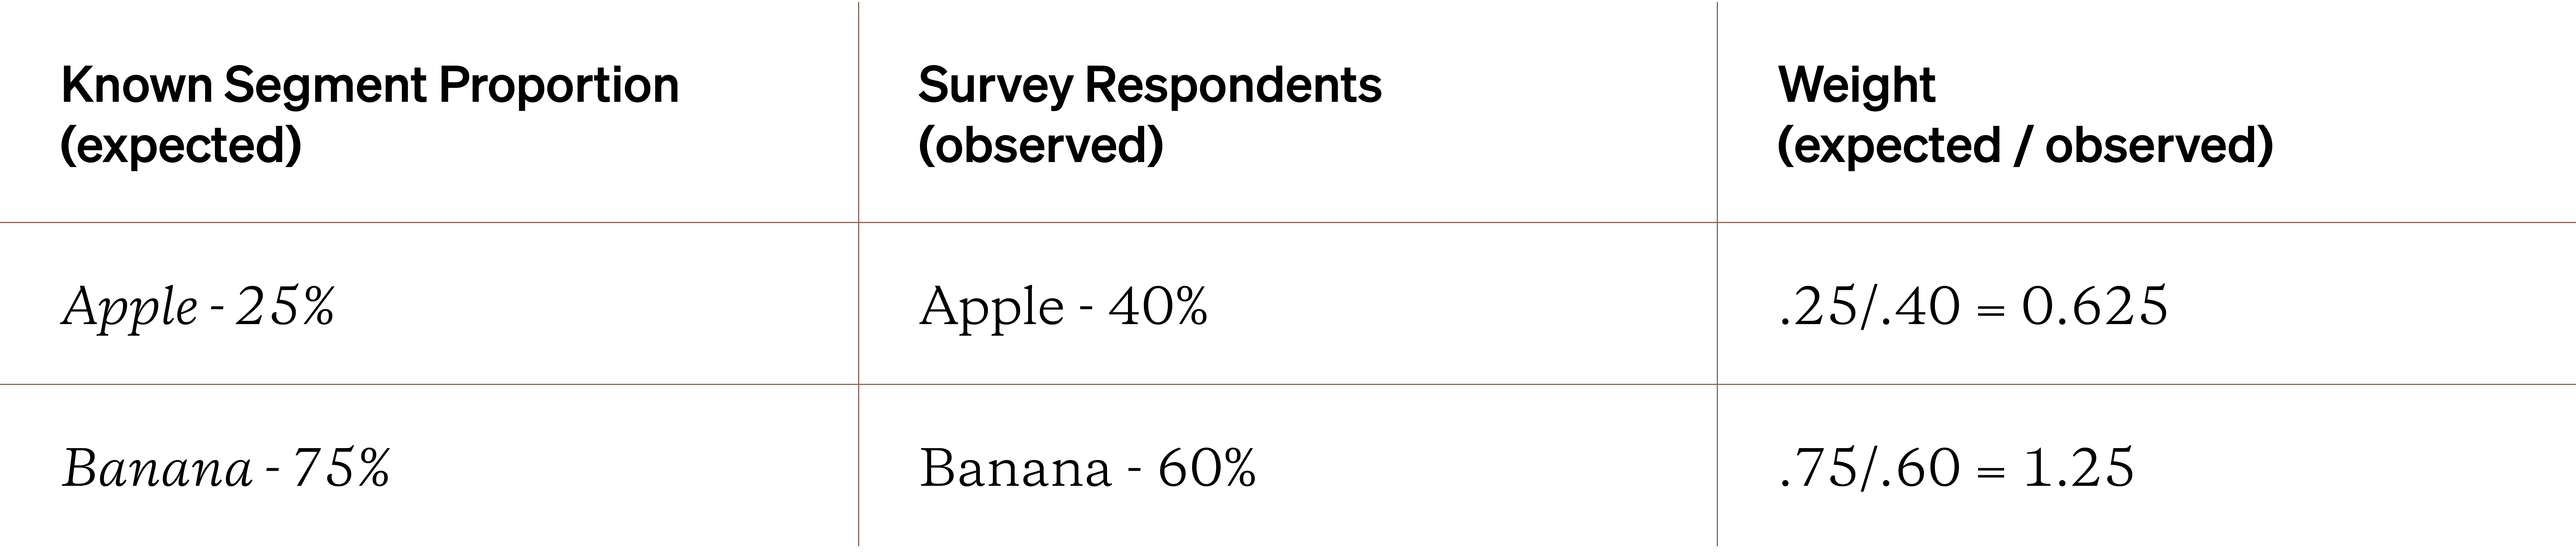
For example, let’s pretend you know your population is 25% apples and 75% bananas. You ran a survey and end up with 40% apples and only 60% bananas. In that case, you might want to balance your sample on the "fruit" variable. You might want to down-weight the apple respondents while up-weighting bananas respondents. Every banana participant would be counted as more than one, while every apple participant would be counted as less than one, as shown below.
From here, you could multiply the relative frequencies for a particular question (such as “what’s your favorite type of movie?”) to get a better view of your data. You can see an in-depth example here of weighting in action.
The example above is incredibly simple. In experience research, It's common to weight two or more variables (such as age, gender identity, product usage, etc.). You might need to use more than a weighting strategy (to account for how you’ve sampled or based on the amount of nonresponse bias you have).
Check out an idea known as "post-stratified iterative proportional fitting" or, more commonly known as "raking” here and here. It's a process of systematically balancing each of the relevant variables. It involves more math, but it can be a powerful tool you have when dealing with unrepresentative samples.
Weighting requires that you know important proportions about your population. Sample balancing is unhelpful if you balance on irrelevant variables (such as height when you're studying if Android users like the redesign). There has to be a real or plausible relationship between what you're studying and what variables you'll balance to assume a representative sample.
Weighting is a double-edged sword.
Weighting, while useful, doesn't come without a cost. While your weighted data might represent your population or segment better than your unweighted data, it doesn’t mean it perfectly represents it. Every time you weight, you’re modifying your data, adding in some amount of bias. Every calculation, graph, and table made with your weighted data includes that bias. To limit the amount of bias when weighting, below are some general tips and rules to follow. You can read more in this article.
Quick Tips for Sample Weighting
- Limit weights to between 0.5x and 2x
- Create weights for the fewest number of relevant variables
- Collect enough data to avoid weighting if you can
Sample weighting is a complex topic and can be approached in many ways. More on weighting and its variants can be found here.
Handbook Closing Thoughts
How many people you learn from can sometimes be just as important as whom you learn from. Small samples and big samples. It all depends on where you research, what's important, and what's possible. Over time, your goal is to recruit faster, with less variability, and reach certain sizes for statistical confidence when needed.
Sample sizes aren’t just about the number. No matter what numbers you see listed here or online, you’ll always be able to find an exception or a negative reason against it. A single, unchanging number will never work across every variation in your research. What matters is how you defend and use the knowledge gained from your participants regardless of how many there were.
Once you know what research questions to study and who your Most Informative Participant is, you enter the third phase of a research study: the study design.
- Sample representativeness
- Sample composition
- Generalization; generalizability
- External validity
- Sample balancing / weighting; sample raking