

Categories vs. Themes
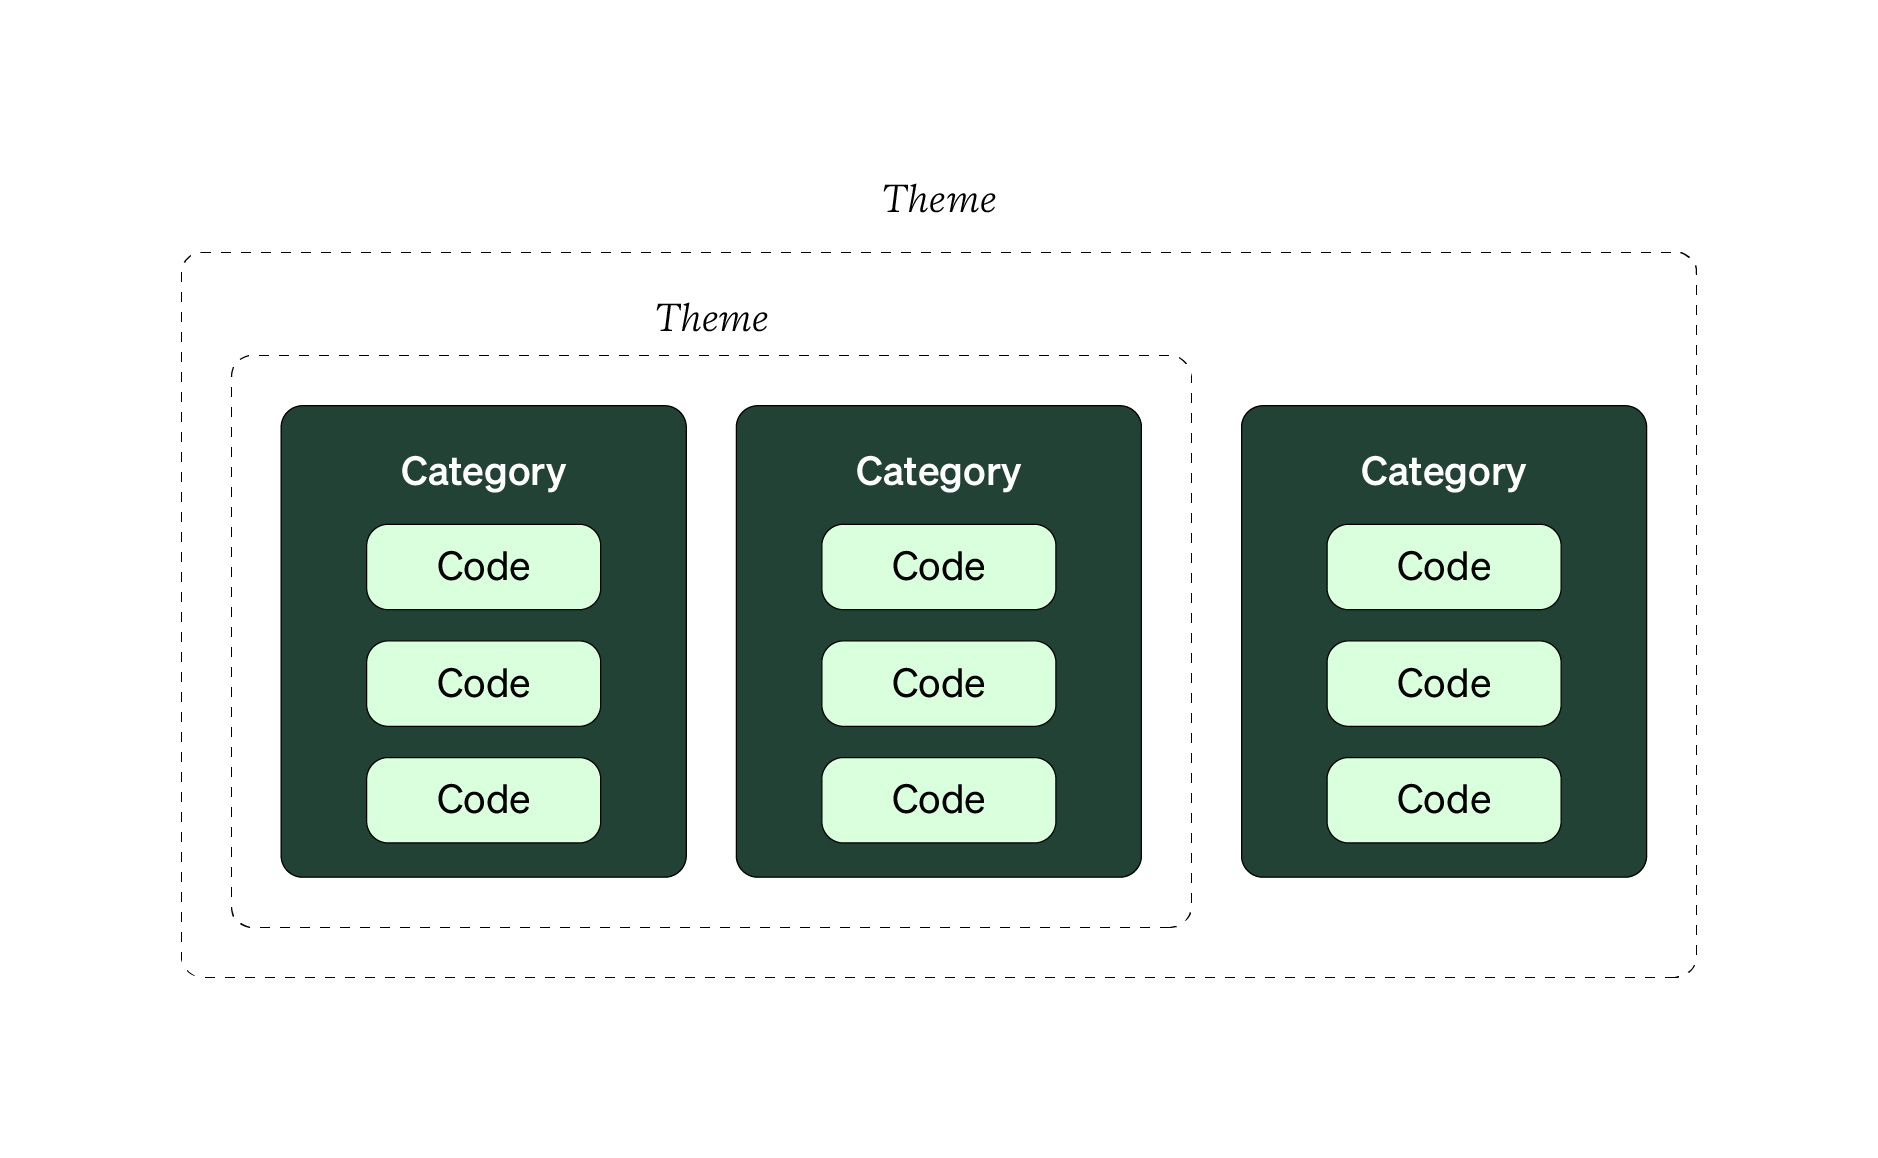
Qualitative categories and themes can feel somewhat similar. They are both ways of assigning meaning to your codes, not your collected qualitative data. But there’s a distinction between how and when you use them in your qualitative data analysis.
Qualitative categories are groups of similar or related codes. You might group codes like “buggy,” “slow,” “unresponsive” into a category labeled “technology issues.” Like codes, you can create incredibly diverse categories, making them customized to every study you run.
There isn’t a set number of codes that magically form a category or theme.
There isn’t a set number of codes that magically form a category. You might form categories with dozens of codes or just a handful, but it all depends on your research questions and study goals. You can also define categories in your codebook to ensure you’re performing a dependable QDA.
You want your categories to be distinct and on the same level. To establish credibility and consistency, codes in different categories should feel different. Codes within a category, however, should feel very related.
Think about each category having a particular type of uniform: if a code isn’t wearing that uniform, it shouldn’t be in that category. You’ll need to have some boundaries or guidelines for what each category should be about. You can also list, abbreviate, and describe categories in your codebook to be consistent with categorizing codes.
Categories should also all be on the same level. You’d find it odd if you went to the grocery store and saw the following aisle names: “dairy, produce, and bananas.” Bananas are an example of produce, but they’re being listed as two separate items.
List all your categories and feel what level they’re on. Do they feel congruent or do they feel all over the place? Rename categories or regroup codes into newer, more appropriate categories to solve issues.
A theme is about what some qualitative data means, implies or suggests.
On the other hand, a theme is a repeated or consistent pattern of meaning in your data related to your research questions and study goals. Themes are less about “What data do you have?” and more about “What is that data trying to say or suggesting?”
Categories can be explicit or implicit, but themes are always implicit and more abstract. Themes are also the product of the you, the researcher’s interpretation, not something static and unchanging (jump to this Topic for more on constructivism).
Your ability to generate themes gets better over time, meaning your sensitivity as a qualitative “instrument” goes up. For example, when you have experience with the research area, visit any relevant study contexts, or spend significant time with the target segment, you make it easier to recognize the meaning and capture it as a theme.
You can also create more understandable themes when you get more knowledge in the specific domain or industry you work in (you create different themes in the medical field than in the financial technology industry).
There isn’t one fixed definition or boundary for a theme, like codes and categories. For example, a theme could be a single idea (such as “positive product perception”), or it can be more complex and multidimensional (such as “Environmental concerns affect purchasing decisions for younger shoppers”).
It’s also possible that you have multiple themes (like in the mattress shipping example later in this subsection). Similar to codes and categories, there isn’t one exact number for themes you must create or have. It’s up to you, the researcher, to create as many or as few themes as necessary to fit your data.
Let’s walk through an extended example to understand how categorizing and theming work together.
Making Categories
Let’s pretend you ran some interviews with some new meditation app subscribers. Your goal with these interviews is understand their experiences with the two-week free trial. You’ve already coded several participants’ worth of the data, and you end up with the codes shown below.
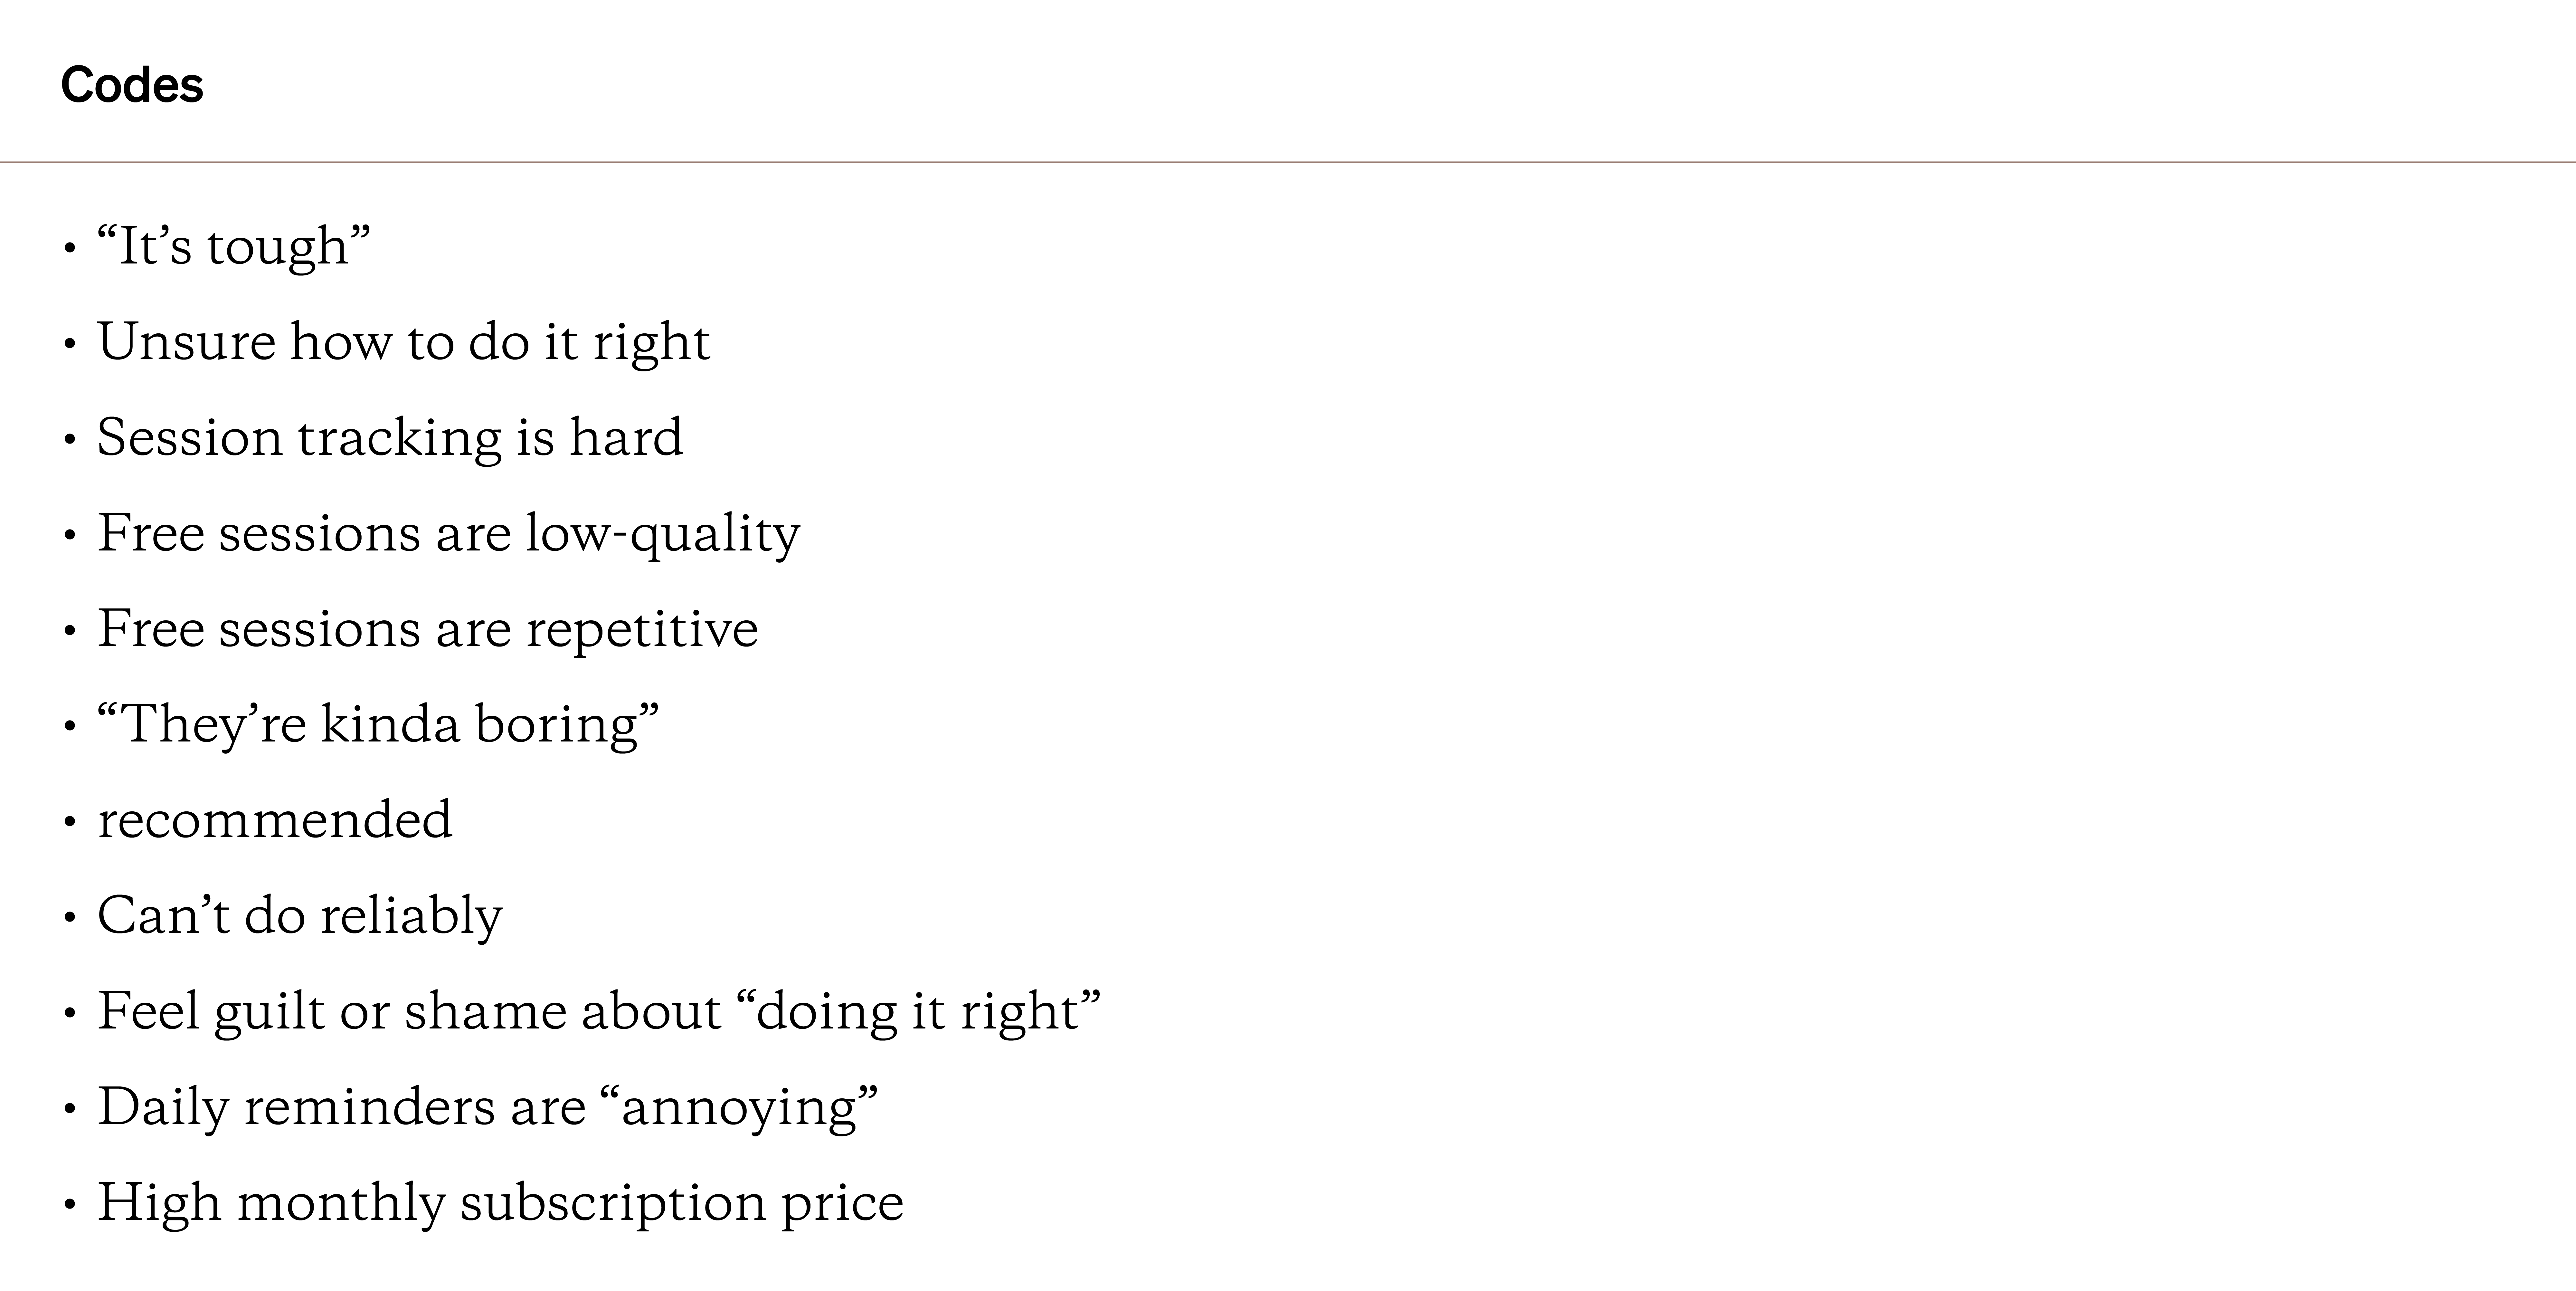
Currently, this list of codes isn’t in a particular order or structure. But when you move them into categories, you can start to recognize patterns. For example, you could rearrange the codes into temporary “positive,” “negative,” and “uncategorized” categories.
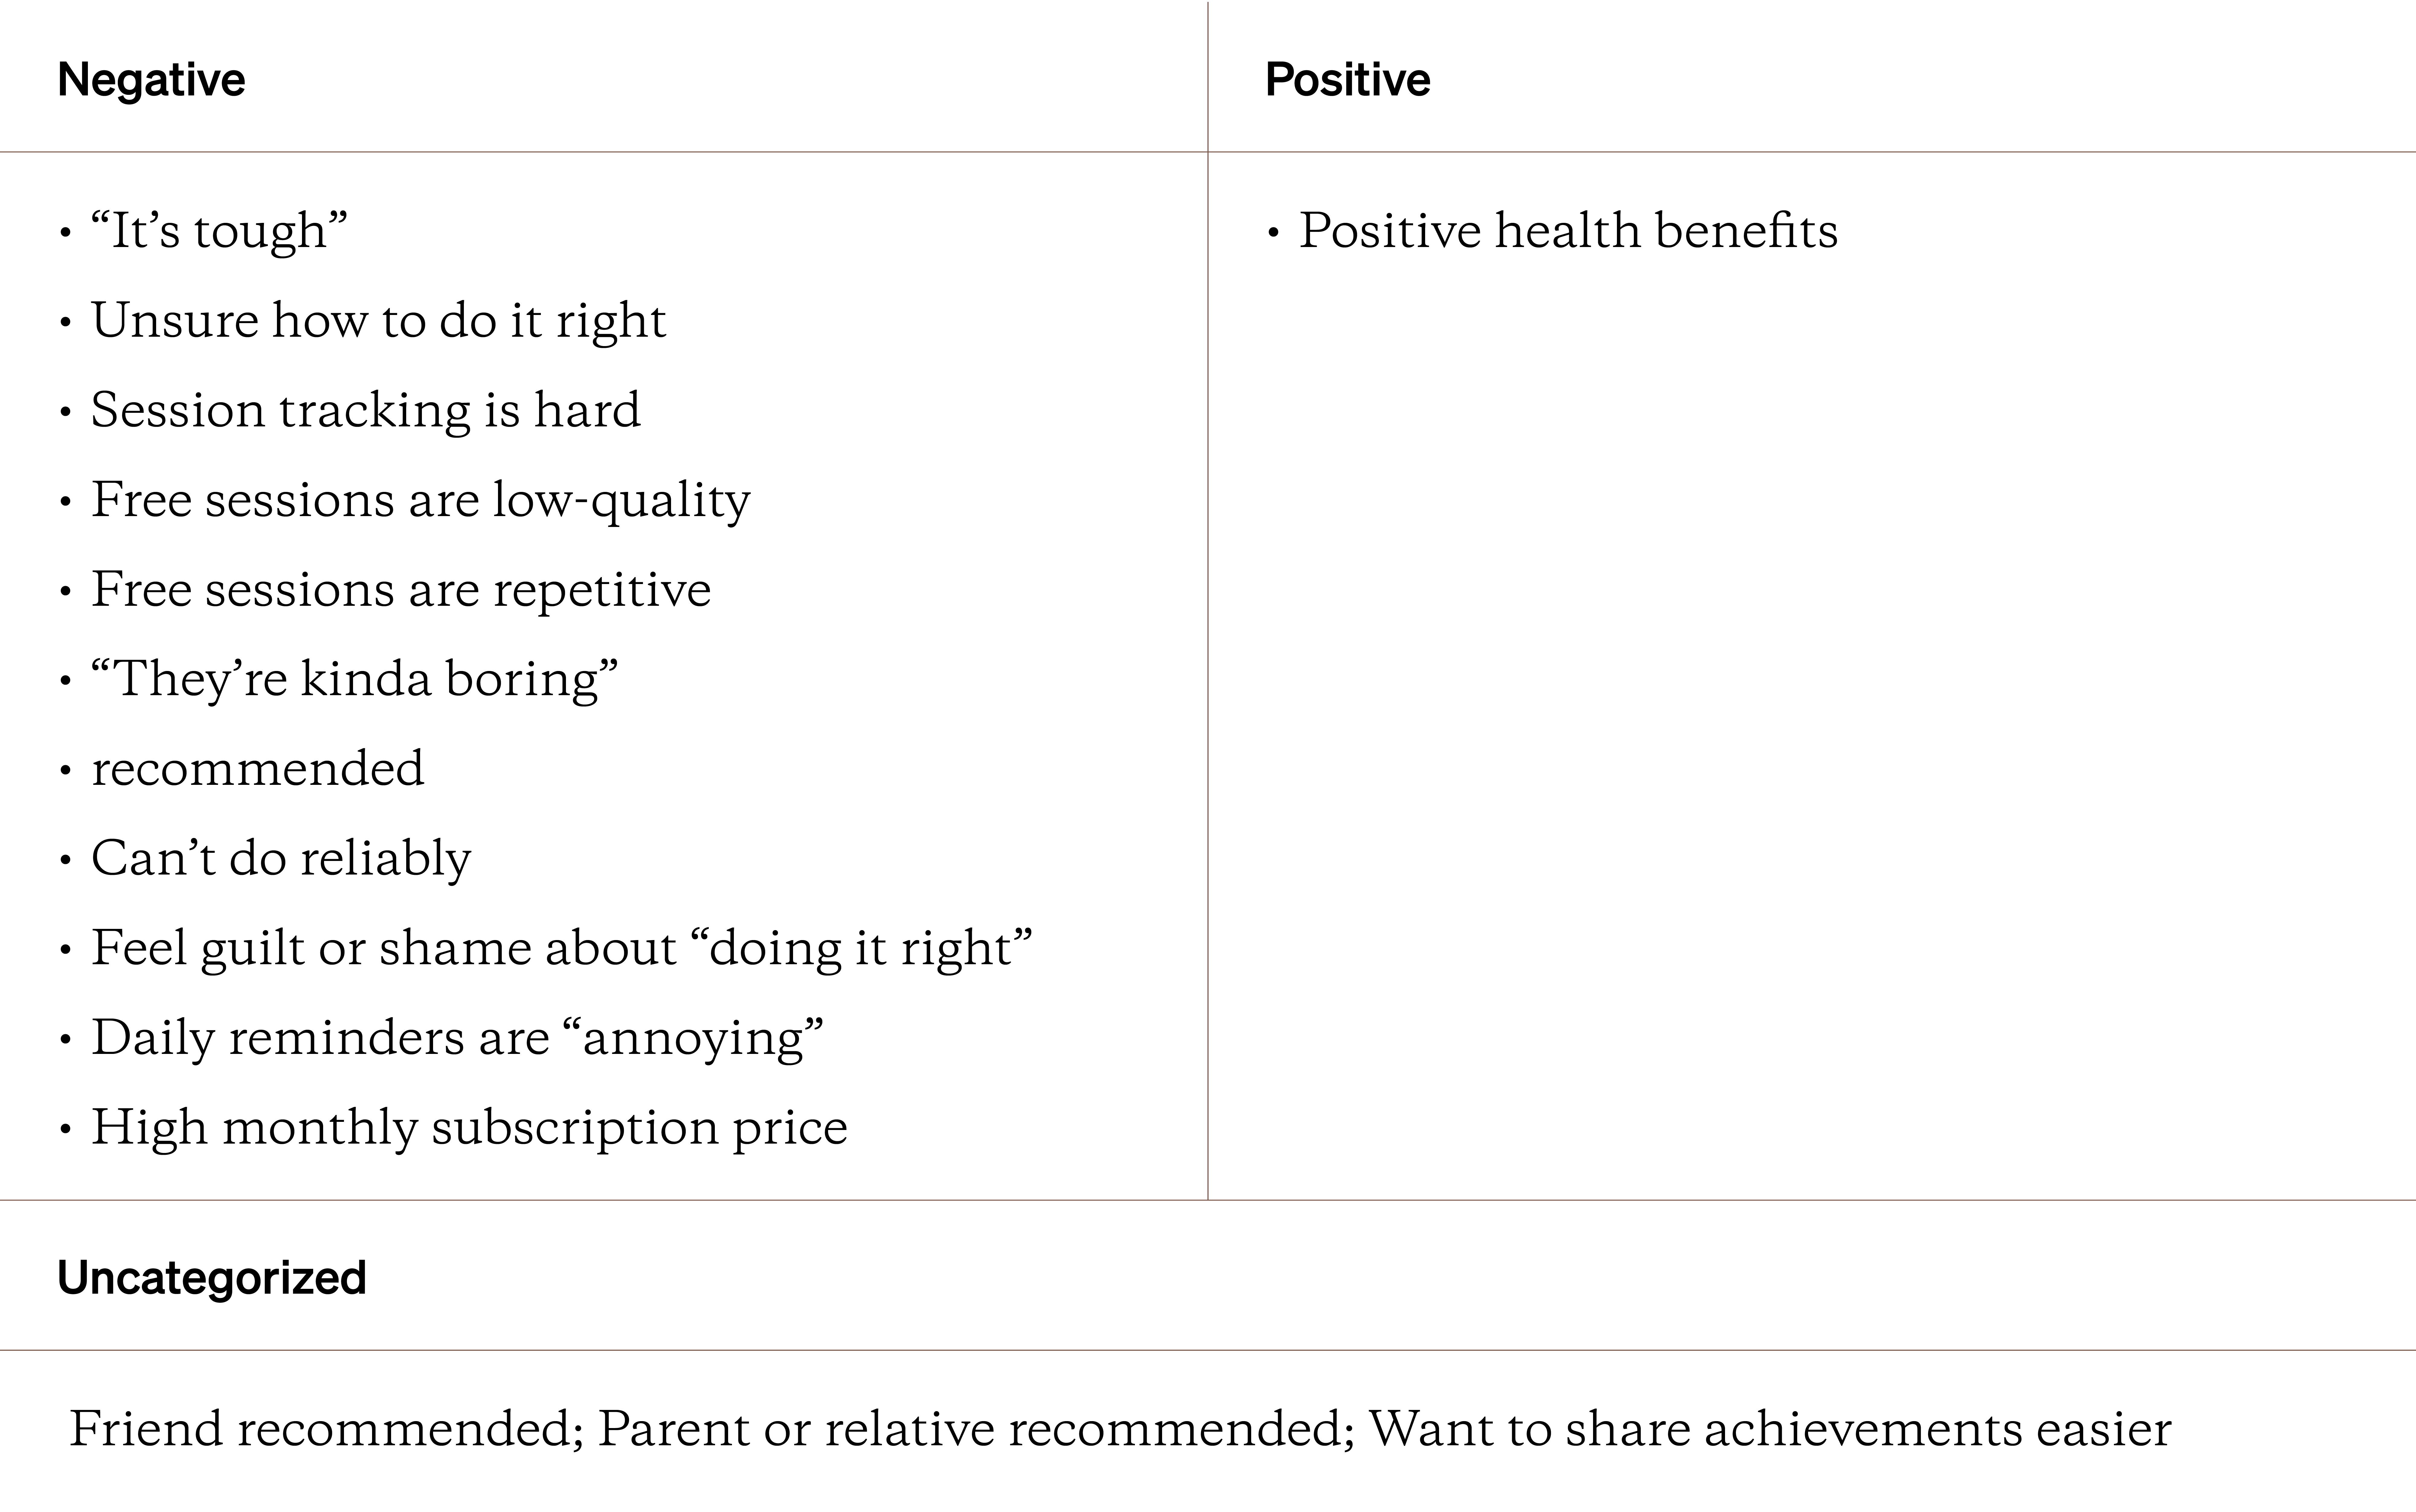
While it helps you start to see patterns, the codes within the categories still aren’t very related. The positive category also has only one code. Let’s recategorize the codes again. This initial positive/negative/other categorization can help you see that the “Uncategorized” category has codes with a social quality. Seeing this, you could then make new categories based on these qualities.
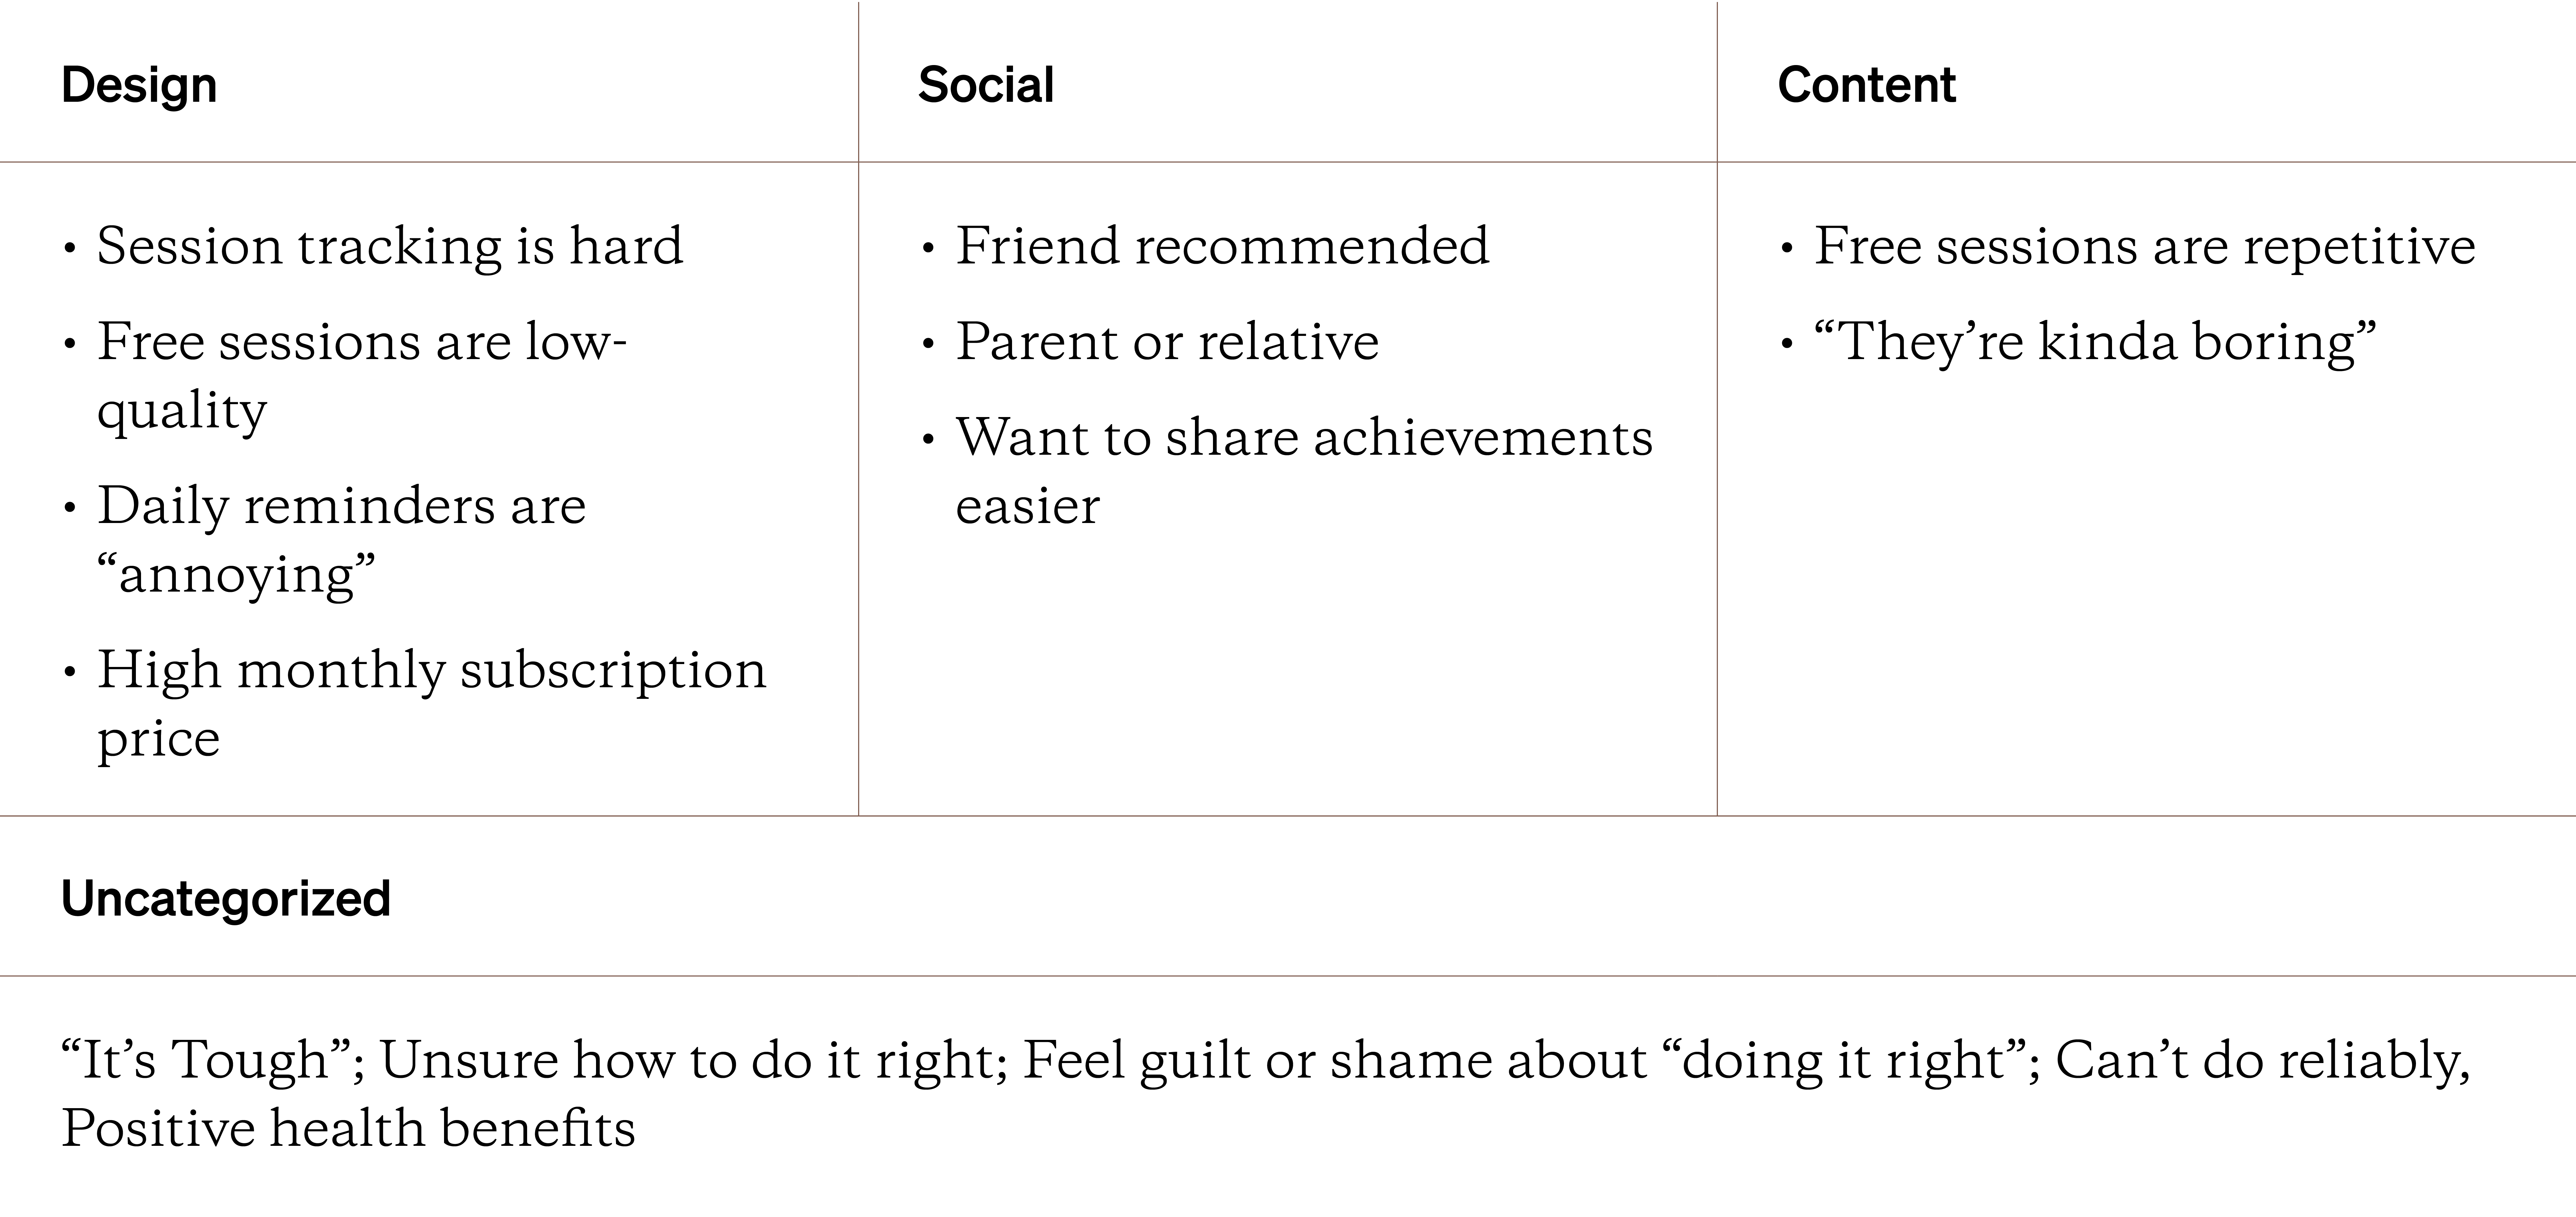
It feels like this categorization is starting to fit the data better. A closer look at the new uncategorized category feels like a “self” or “internal” component affects how people use this meditation app. You could then create a new “internal or self” category, getting to more robust and helpful categories.
When categorizing, it can helpful — and energizing — to abandon your computer or spreadsheet in favor of a pencil and paper. Similar to a code shorthand, you can create a category shorthand. On large piece of paper or other drawing surface, list out all the category shorthands. Make sure to leave space between the categories so you easily connect and describe how categories are or aren’t related. Pull in specific codes or qualitative data to enrich the drawing. You can also look to make qualitative displays, or ways of visualizing or representing qualitative data. You can learn more about displays with this article.
After categorization comes the most challenging but rewarding part of qualitative data analysis: theming.
The Cloud Fish (or Generating Themes)
One of the confusing things about qualitative themes is recognizing and generating them. You don’t “find” qualitative themes in your data; you generate them. Recall that qualitative research is fueled by the constructivist research philosophy, which suggests meaning is constructed. This means first recognizing meaning within your data and then generating a theme that fits or captures that meaning. It’s this active, intentional theme creation process that makes qualitative data analysis so useful.
.png)
To make the idea of theme generation easier to understand, think about this scenario: imagine that you and your friend are lying the grass, staring up at the clouds. Your friend turns to you and says “Hey, that cloud looks like a fish.” In practical terms, the fish isn’t real nor does it exist.
But in your interpretation, the fish in the clouds is real. You might not notice the fish at first, but after someone points it out, it’s almost impossible not to see it. Themes work the same way - they don’t necessarily exist in the real world, but they’re real to the researcher willing to look for them.
You don’t “find” qualitative themes in your data; you generate them.
When designing your qualitative study, however, you have some idea about the themes you or your stakeholders will find valuable. It’s not as overwhelming as generating themes in an endless space but about creating themes that work within your context and addresses your research questions. Use your research questions and study goals as boundaries to figure out if any potential themes are relevant or not.
Avoid using code or category frequency as the only way to generate themes. Just because participants say similar phrases, or you notice consistent categories across your data doesn’t guarantee that it’s a theme.
This approach is more like content analysis, where frequency is important when understanding data. With thematic analysis, you should view frequency as one tool or way to help generate themes. While things that happen more often could be a theme, you have to validate them (covered in the next Topic).
Avoid using code or category frequency as the only way to generate themes.
In the following theming example, you might disagree with the codes, the categories, or the candidate themes are shown -- and that’s fine! While it’s true that every researcher has their unique worldview, it’s because of these individual experiences that allow someone to create credible and powerful meaning from qualitative data. In your analysis journal, make sure to think reflexively about how you’re creating themes so that your worldview doesn’t bias, skew, or distort your final themes.
Guide 11: Using an Analysis Journal
Let’s pretend that you’re creating themes around the delivery experience for an online mattress company. You were sent a list of hundreds of customer reviews from your data scientist colleague. Your stakeholders want to understand the common themes in positive reviews so they can market more effectively. For the sake of brevity, let’s focus on these three randomly selected comments:
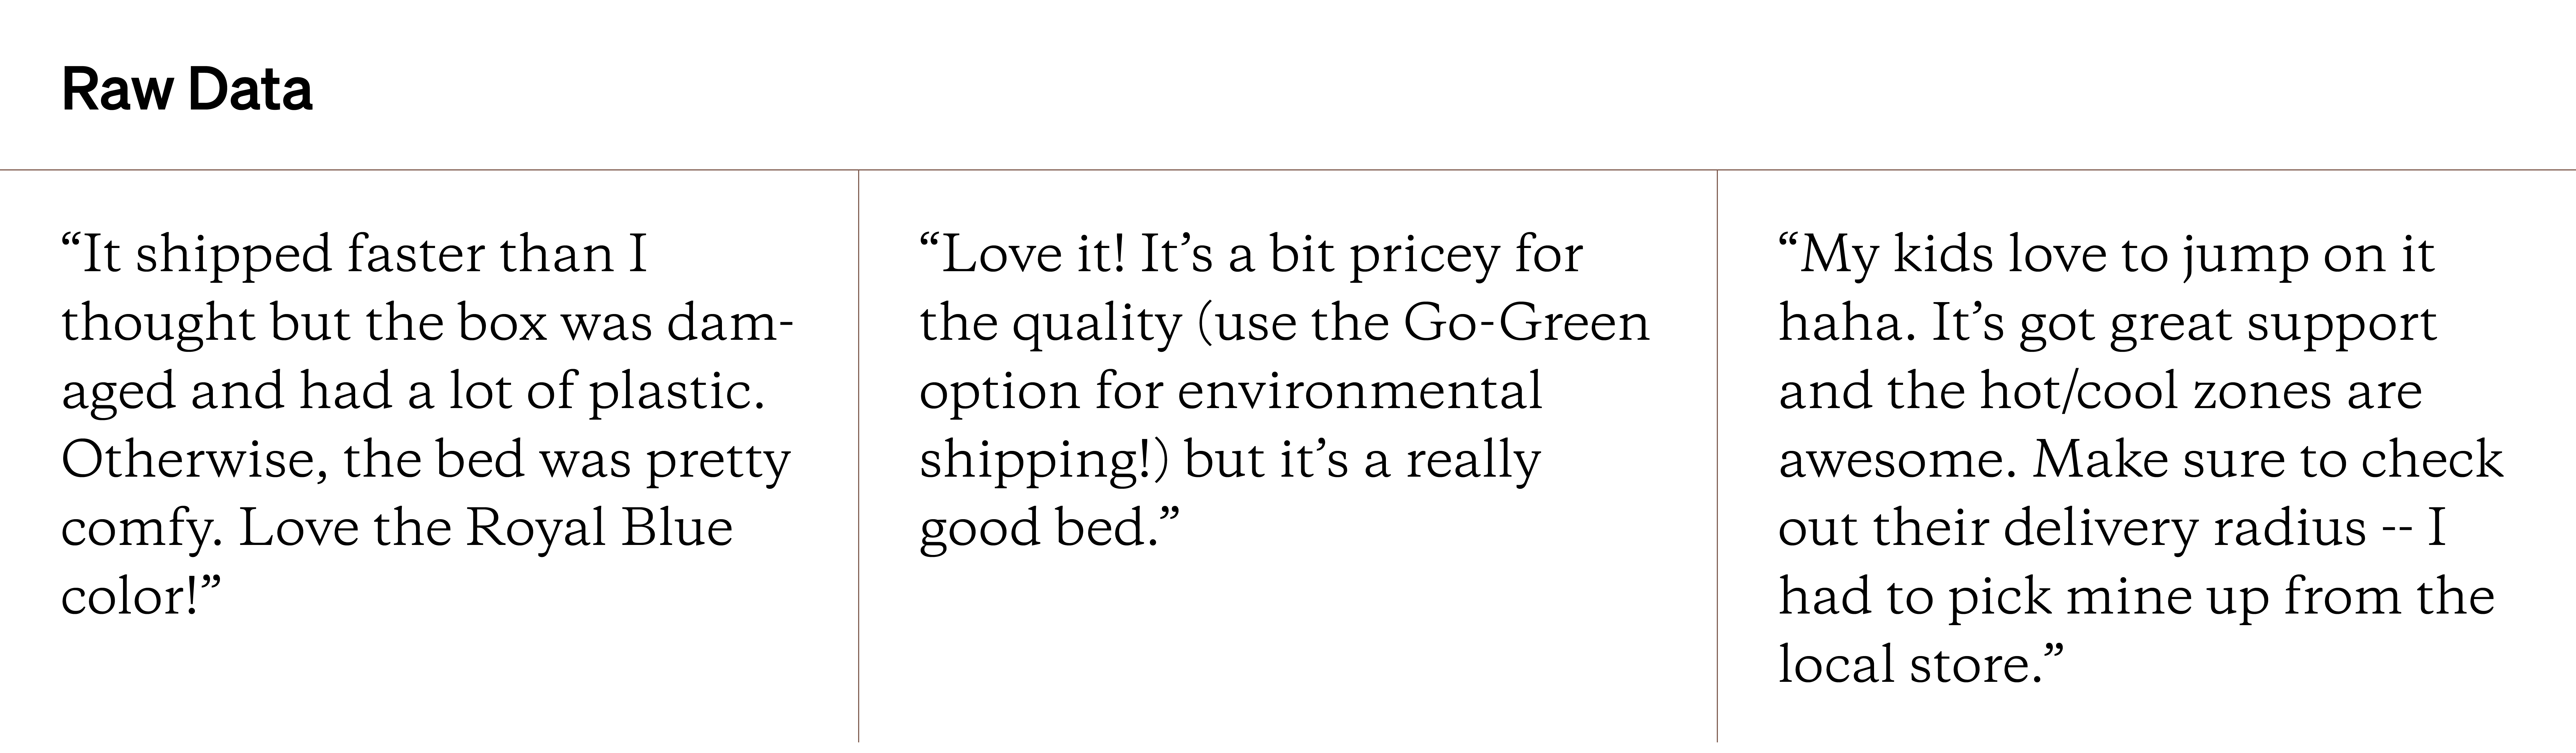
There’s a range of emotions and topics in just these three comments. Let’s code and categorize this data to start generating themes.
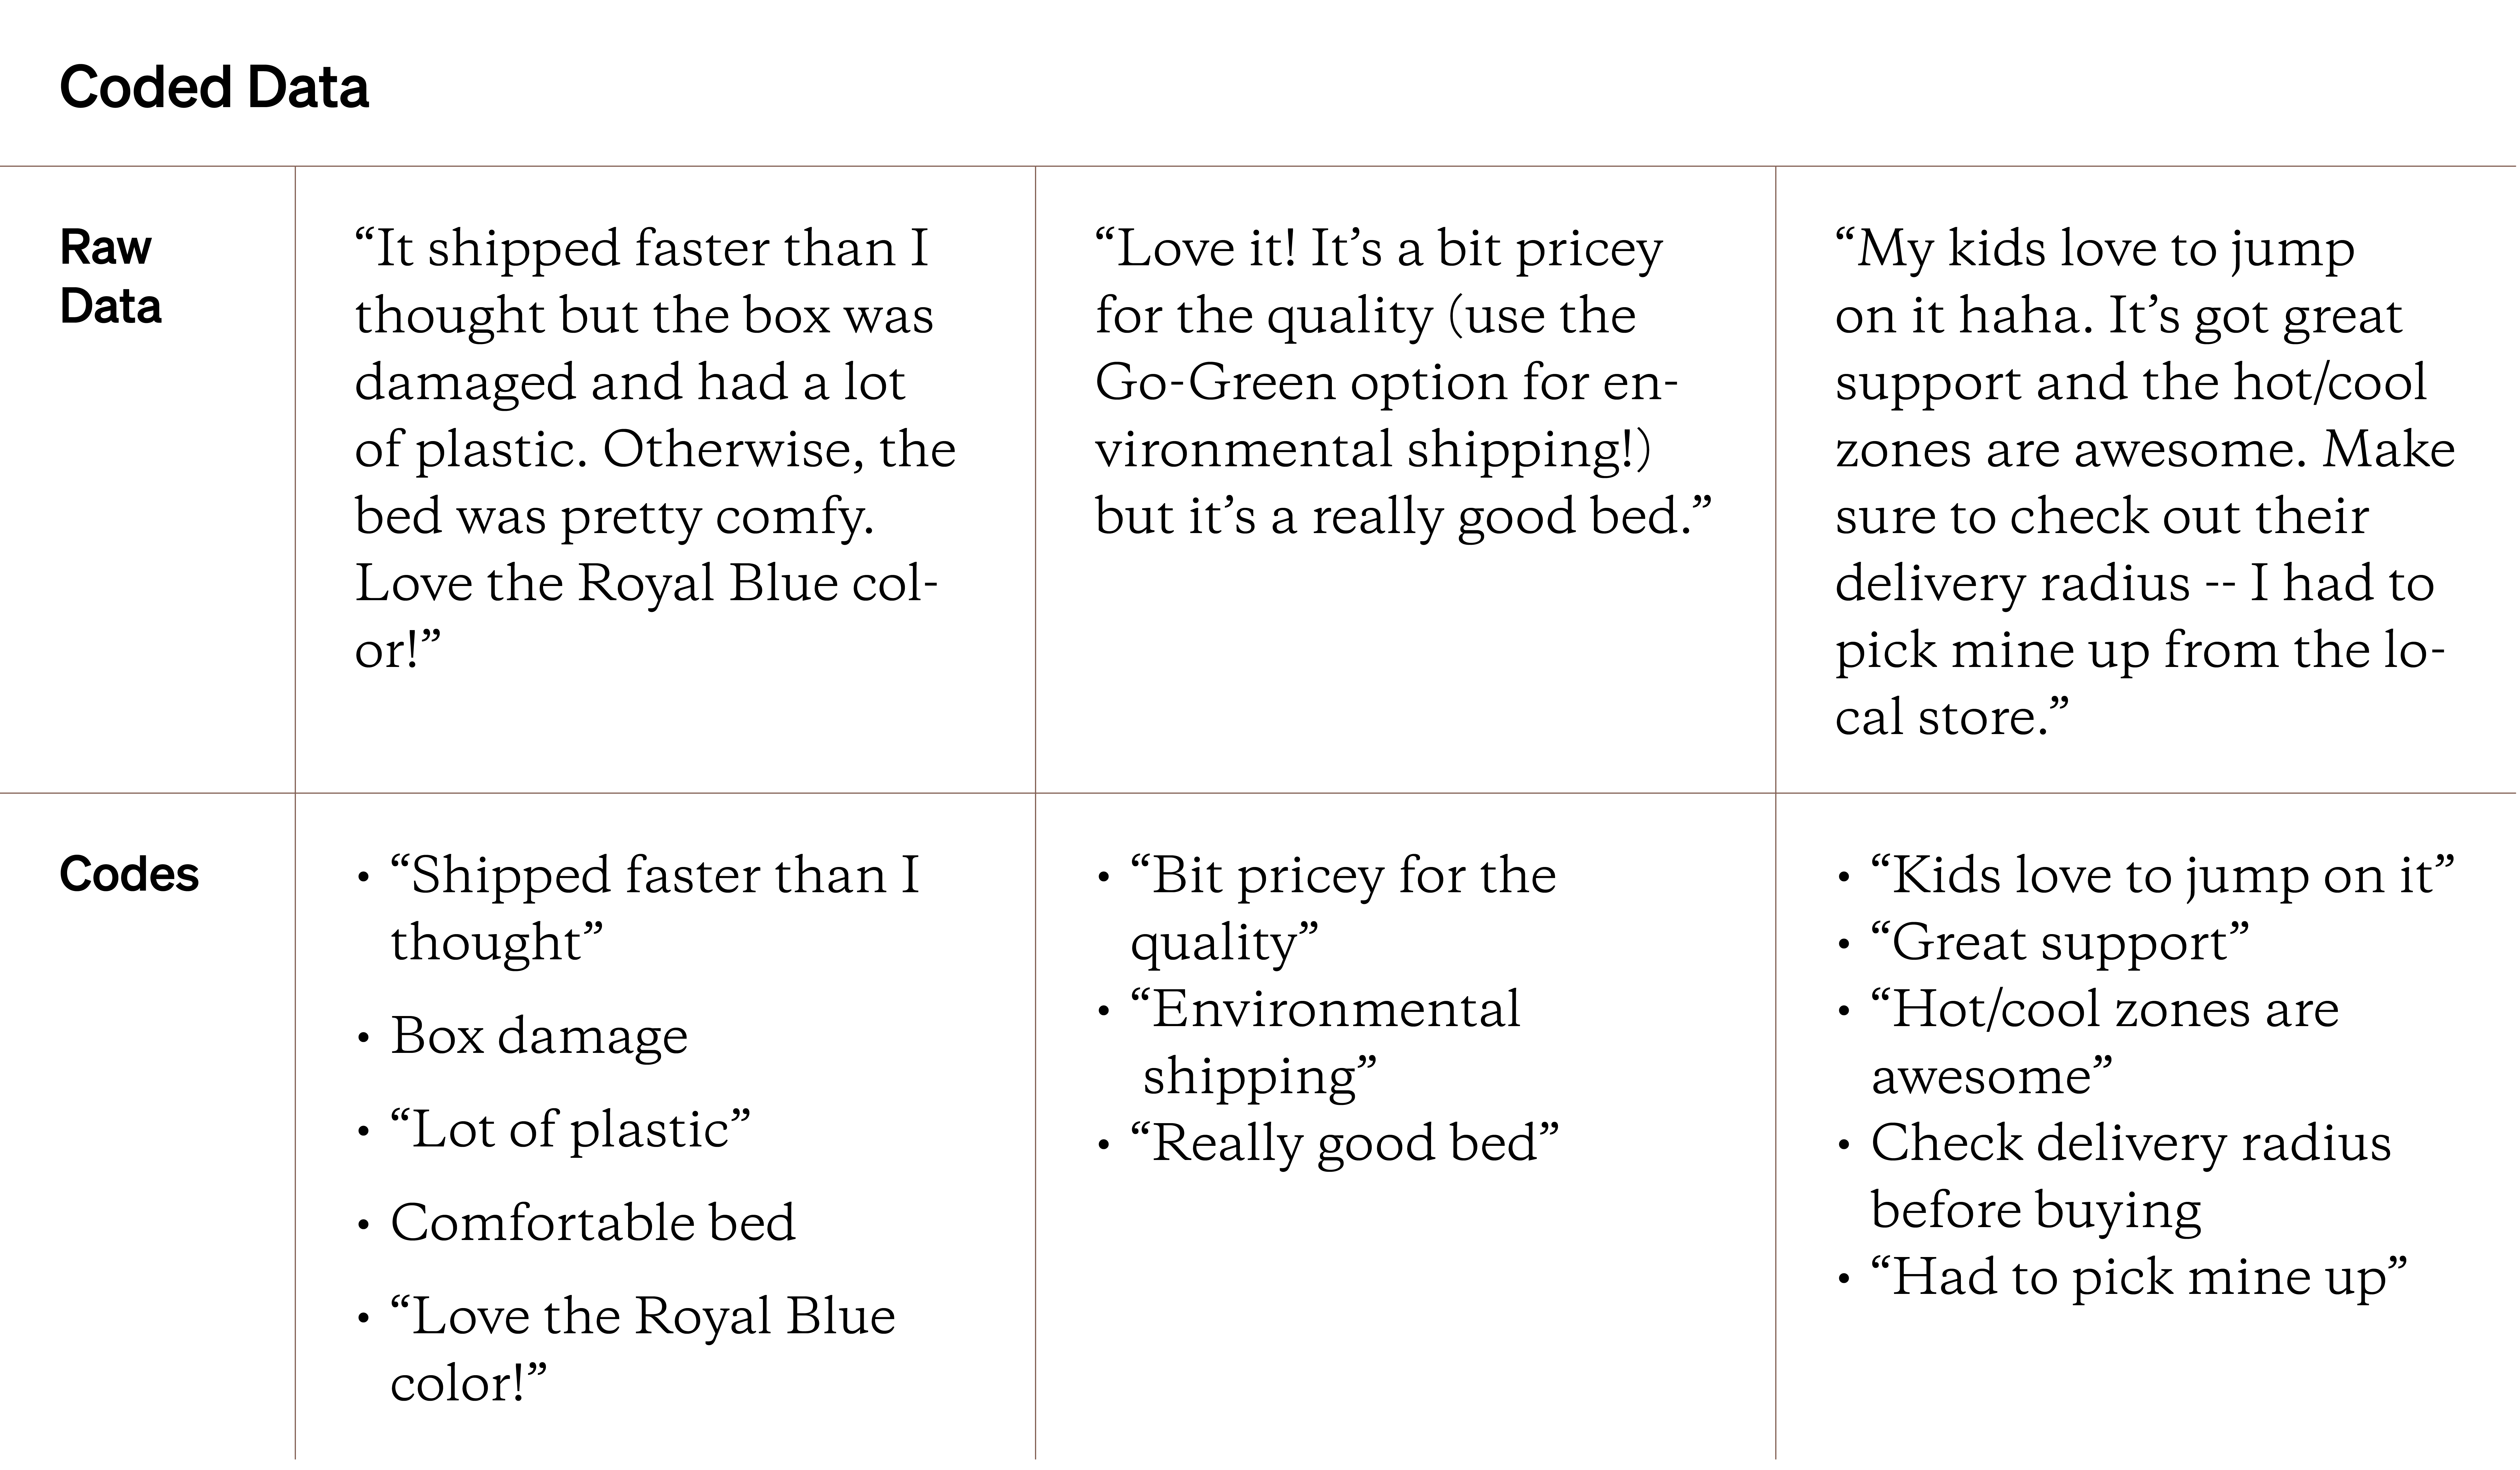
You can see there’s a range of code types and skimming through them helps you quickly parse through the larger raw data text. Now, let’s categorize them.
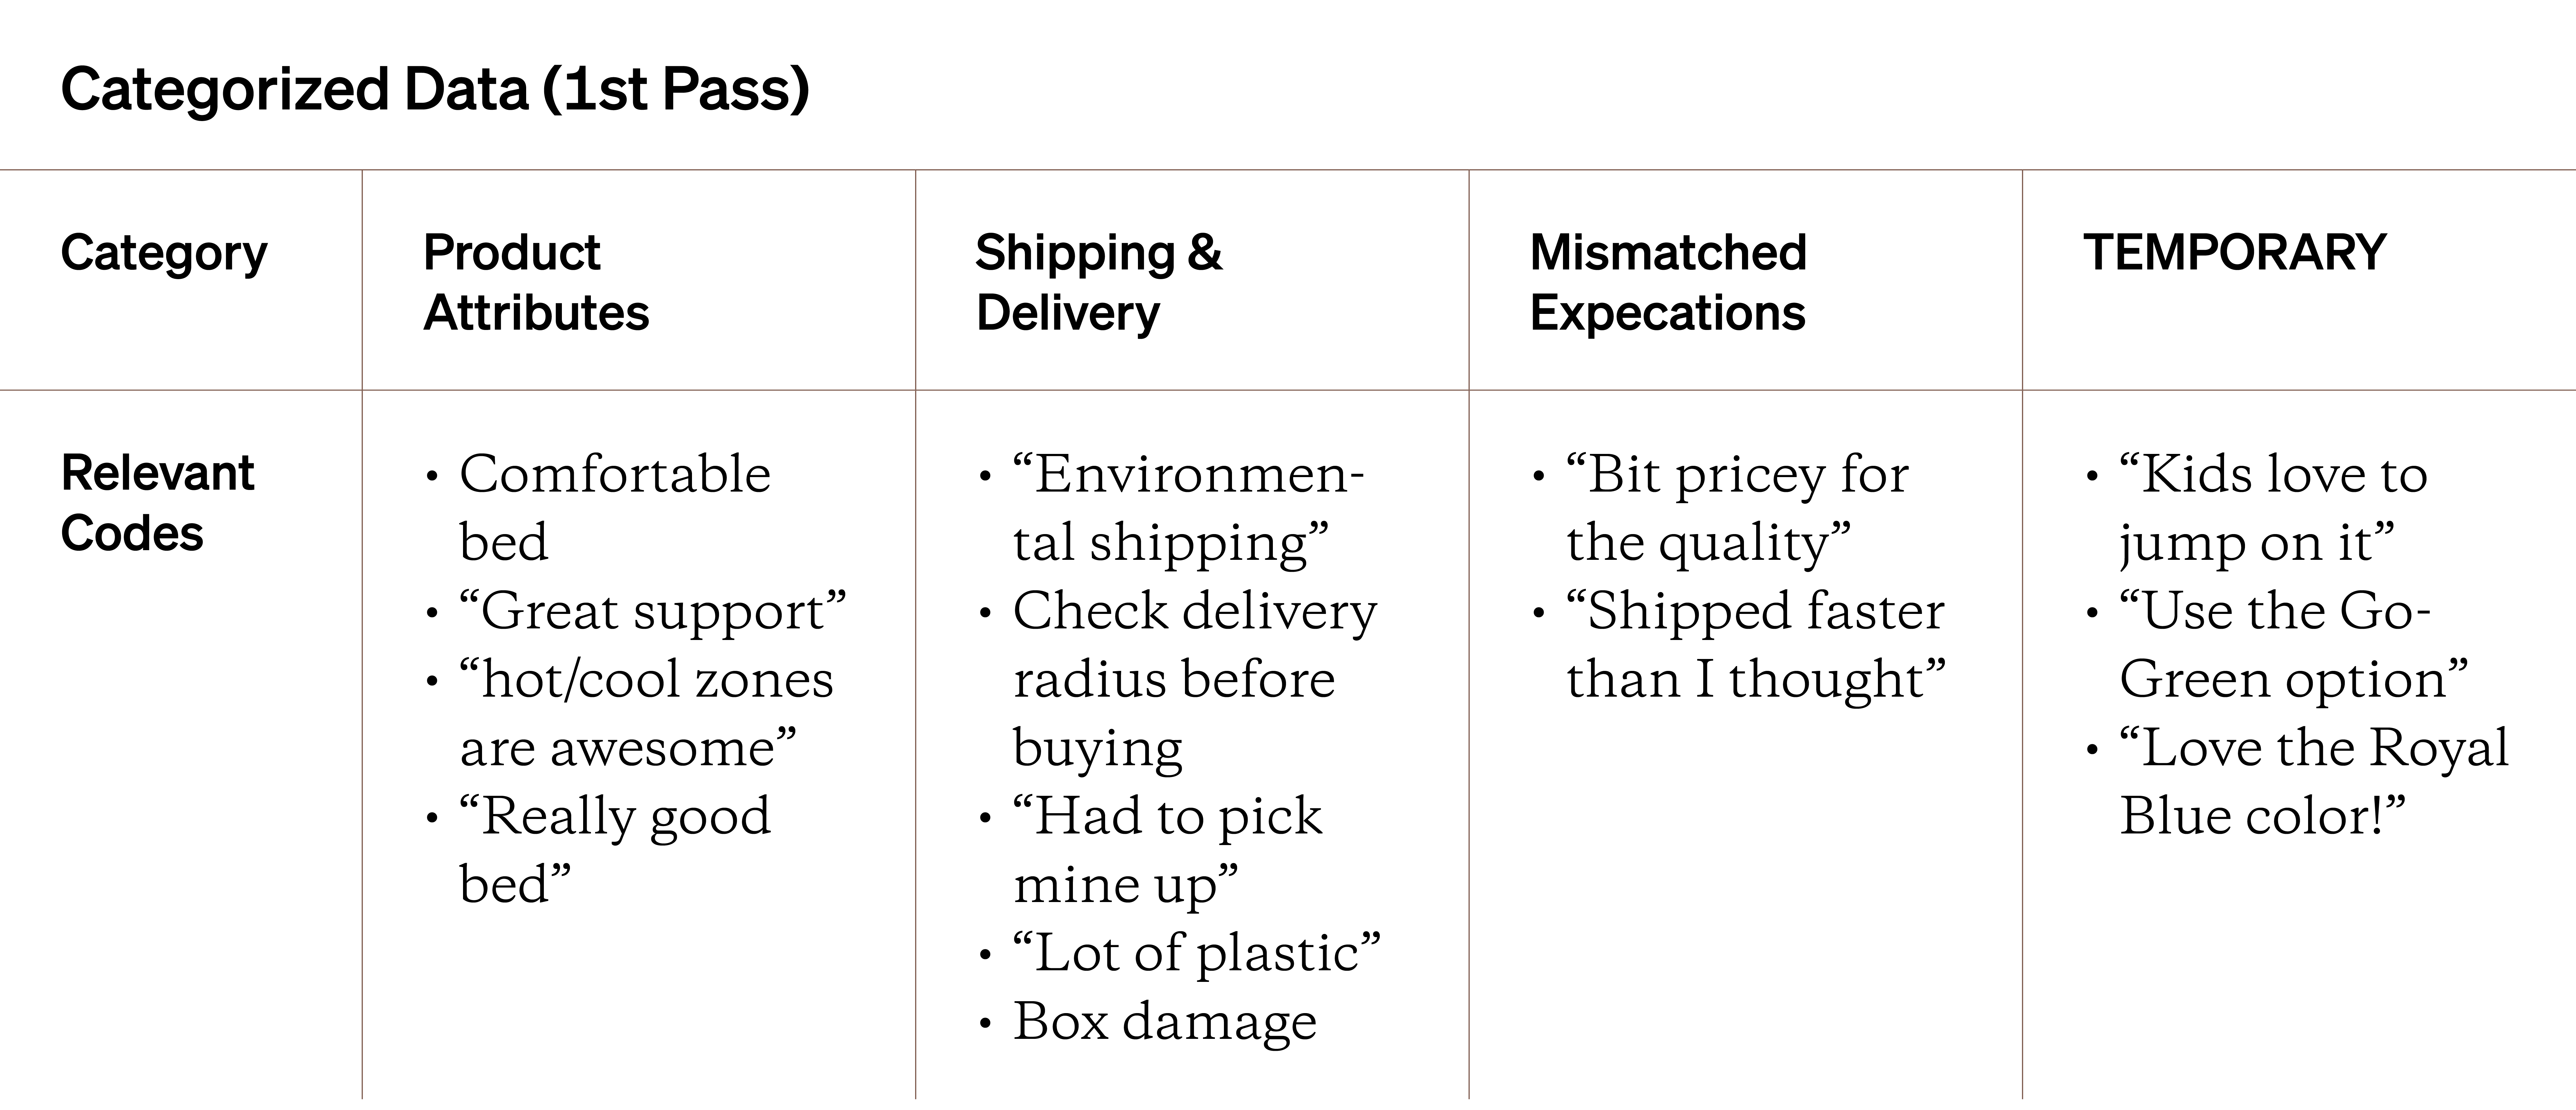
The categories for the codes are a good place to start. But, rereading the codes, you can start to see a pattern: environment or sustainability issues. Let’s add that category and reshuffle the data. Let’s also strike through some codes that don’t fit the current categories or aren’t relevant to your study goals.
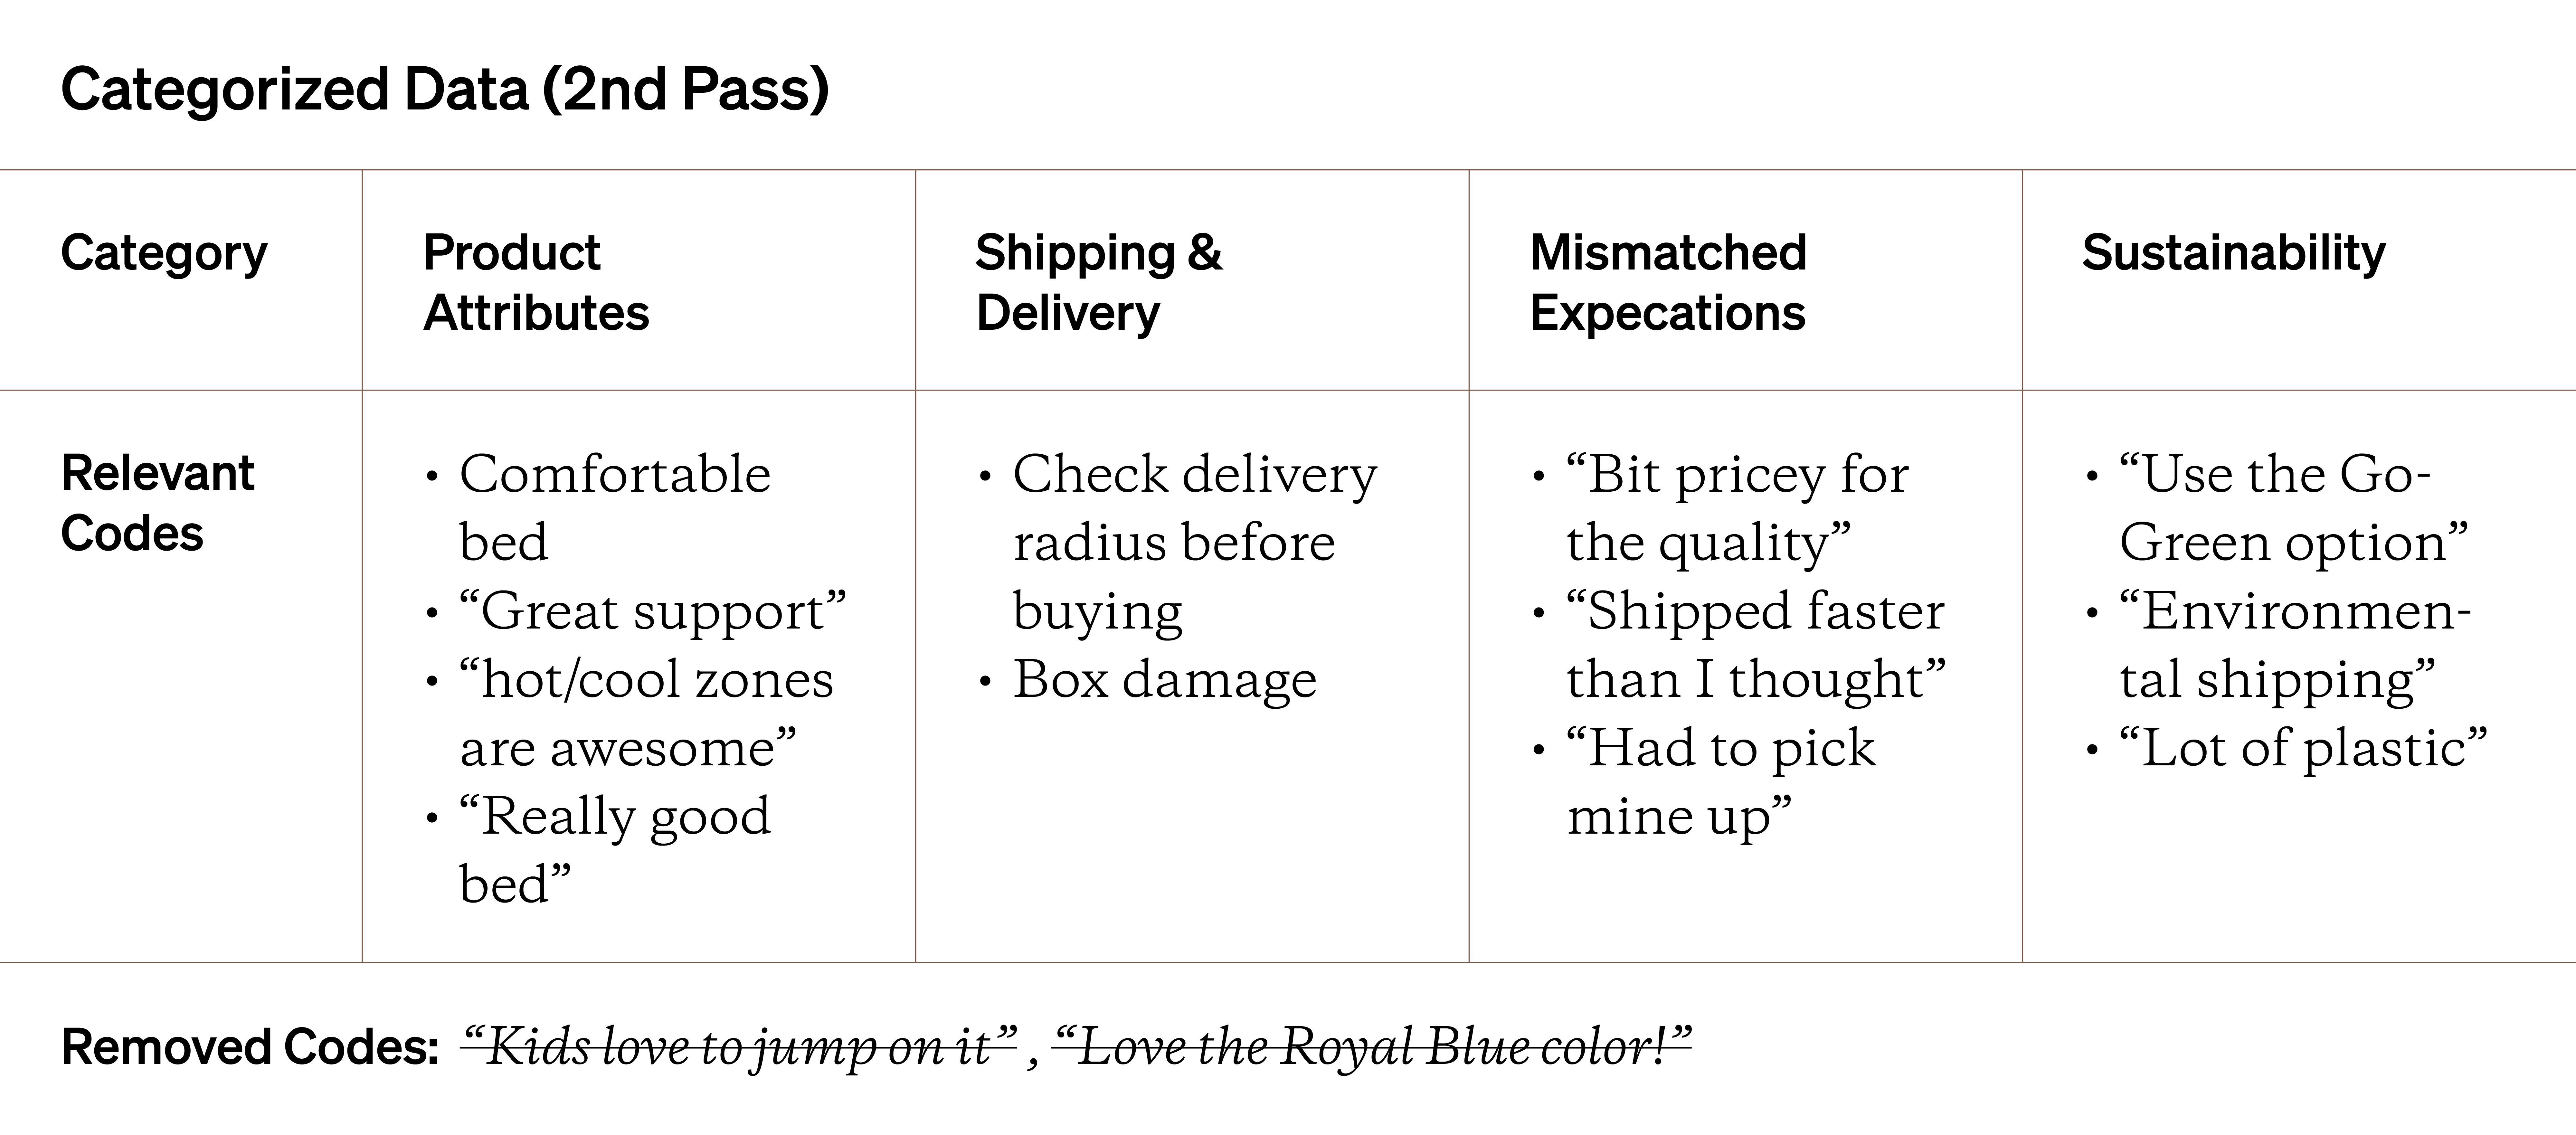
The ‘Shipping & Delivery’ category is much smaller, and the newly created ‘Sustainability’ category robustly fits the codes it has. The removed codes don’t fit the other categories or are too personal (a color preference) to be useful. By scanning the categories, it seems like these customers did have an overall good experience with the actual bed, but how it got there seems to be an issue. Let’s start to group categories to create themes.
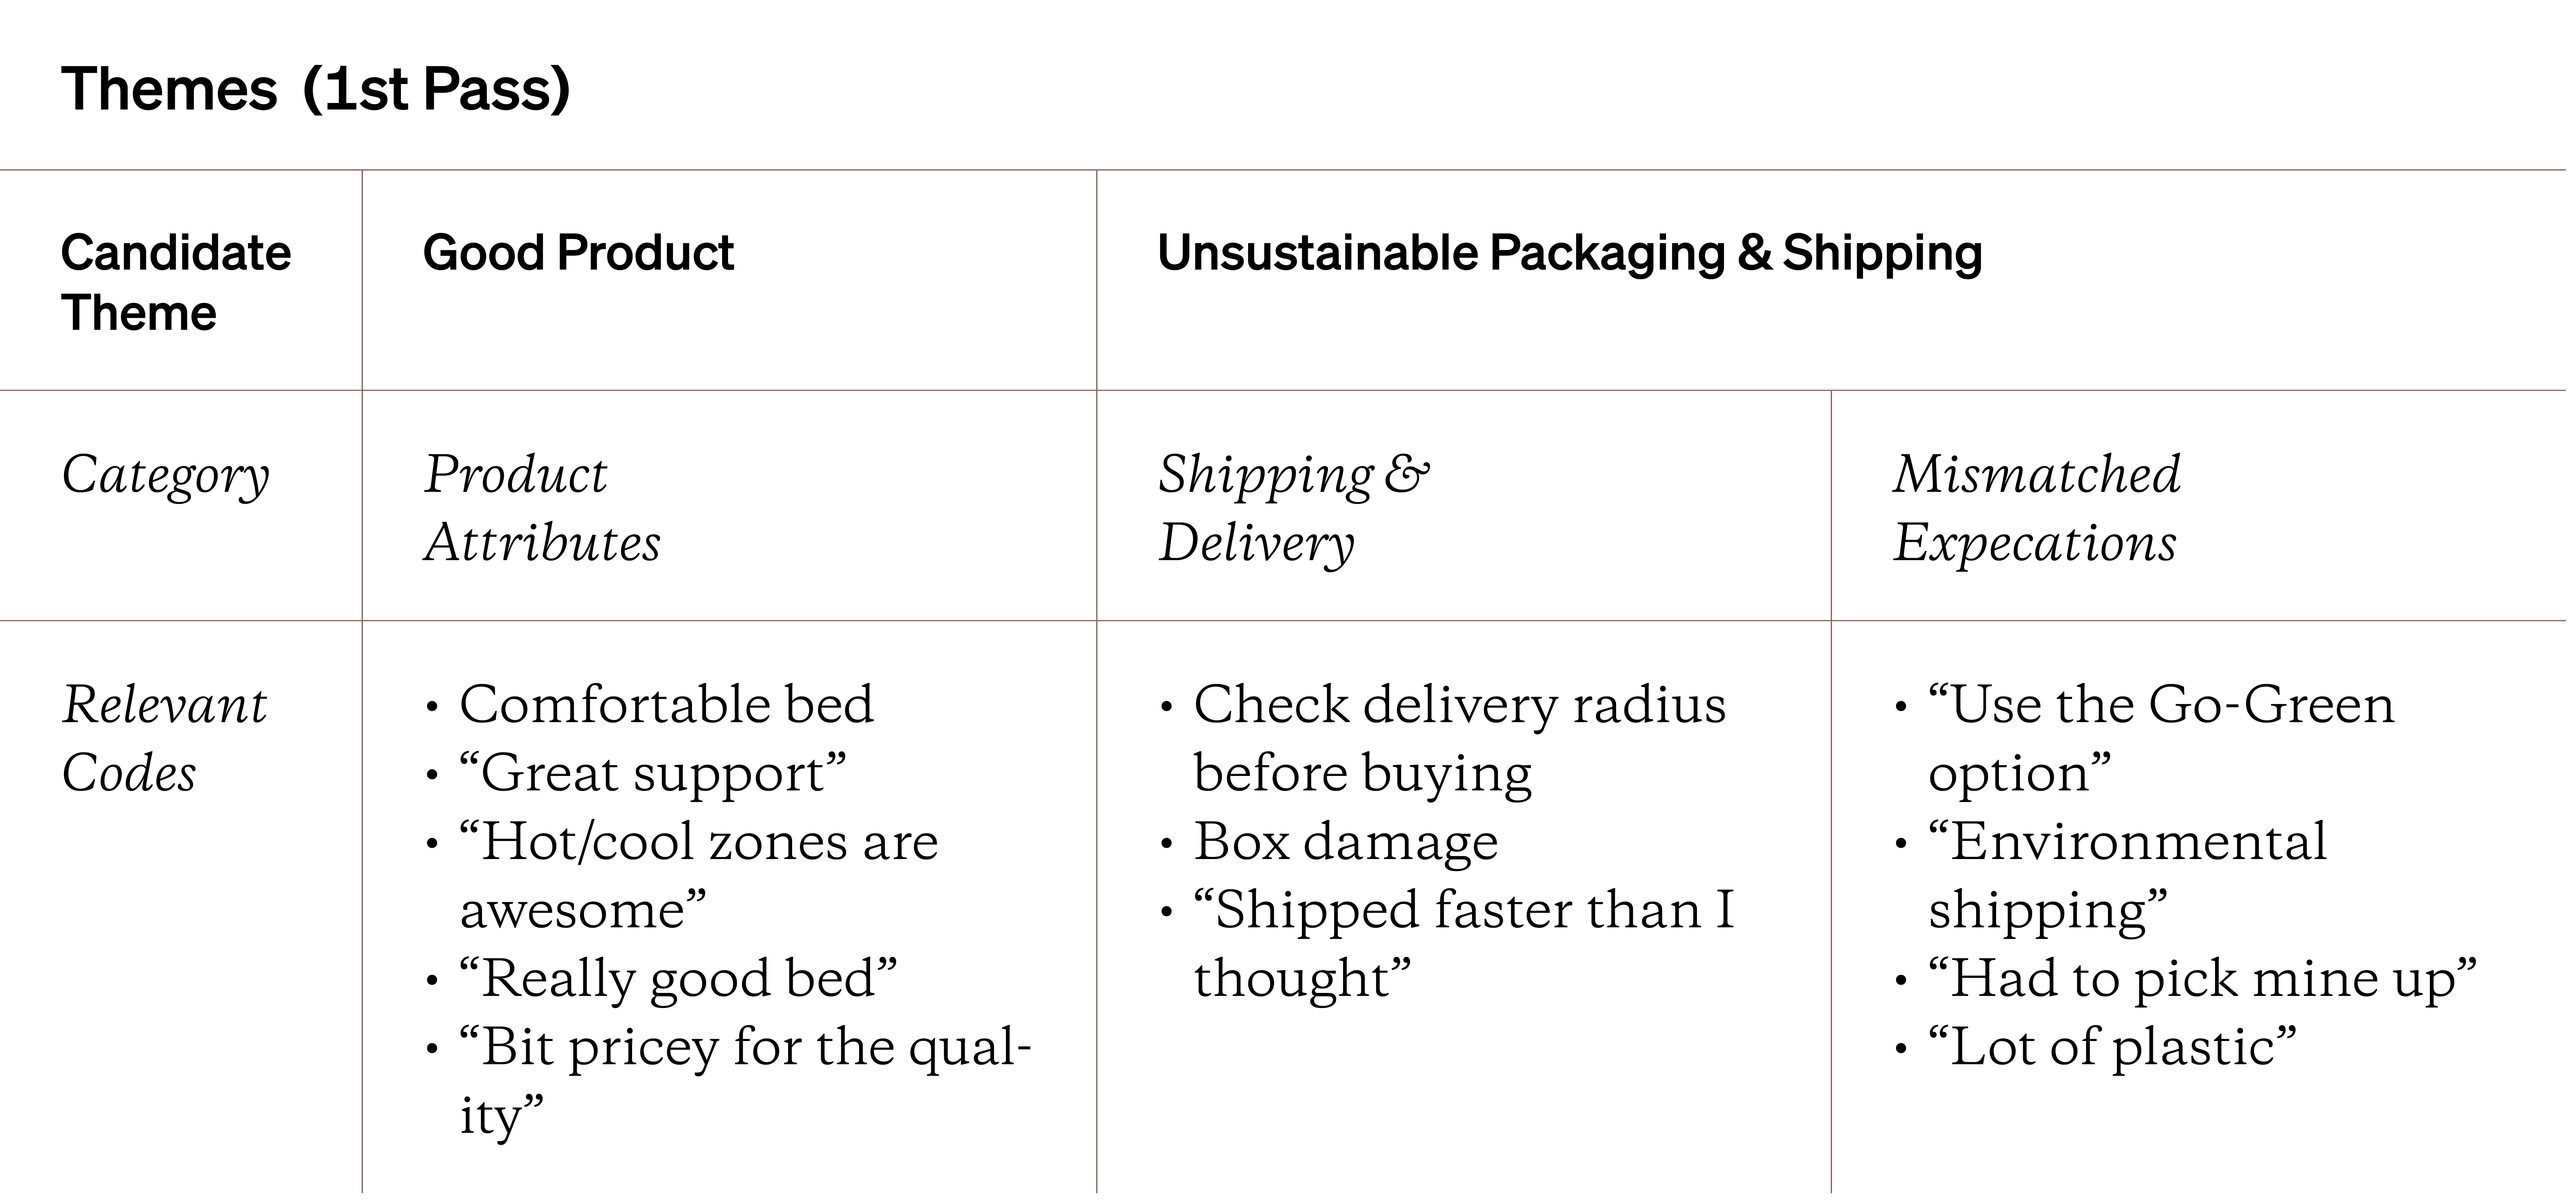
The ‘Mismatched expectations’ category was joined with the ‘Sustainability’ category, while the actual pattern in the ‘Product Attributes’ category became the ‘Good Product.’ You might choose to eliminate the “good product” theme because it’s doesn’t help explain the delivery experience. I
n the end, you could view the draft theme (aka a tentative, unvalidated pattern) of these comments as: “The delivery experience is good but doesn’t feel environment-friendly.” As a researcher, you would then revisit your structured qualitative data to validate if this theme fits your raw data.
This is a crude example, but this idea of grouping, reflecting, reshuffling and pattern-recognition within the codes and categories is the process of theming. This example uses tables to create themes, but don’t be afraid to get more creative. Try Venn diagrams, flowcharts, tree graphs or mind maps, and more. A diverse approach can help you avoid fatigue in the QDA process and see unique patterns otherwise hidden.
One idea mentioned throughout this handbook has been this idea of testing your themes. But what does it mean to test your themes?
- Qualitative matrix display
- Qualitative network display
- Qualitative display graphics
- Axial and selective coding